

Beschreibung
# 🚀 Kinetic Slippage Index (KSI) – Fortgeschrittenes Tool zur Analyse von Marktdruck & Liquidität
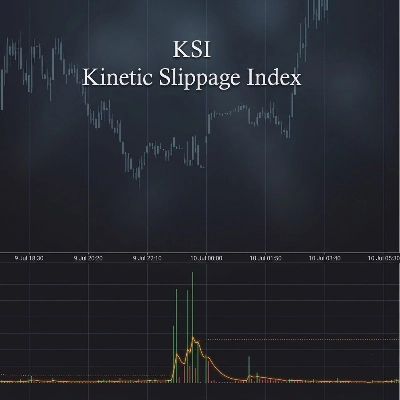
Entdecken Sie tiefere Markteinblicke mit dem **Kinetic Slippage Index (KSI)** — ein leistungsstarker Handelsindikator, der ungewöhnliche Kursbewegungen, Volumenungleichgewichte und potenzielle Liquiditätsereignisse erkennt, bevor sie im Chart offensichtlich werden.
Entwickelt für Trader, die **Marktstruktur, Volumenverhalten, Volatilität und institutionelle Aktivitäten** analysieren, kombiniert KSI Range-Erweiterung und Volumendynamik, um abnormale Marktbedingungen zu messen.
## 🔥 Hauptmerkmale
✅ **Berechnung des Kinetic Slippage Index**
* Misst die Beziehung zwischen Kursbewegung und gehandelt Volumen.
* Erkennt Situationen, in denen der Kurs im Vergleich zum normalen Volumenverhalten unverhältnismäßig stark schwankt.
* Hilft, potenziellen Liquiditätsstress, aggressive Marktaktivität und ungewöhnliches Momentum zu identifizieren.
✅ **Adaptive Spike-Erkennung**
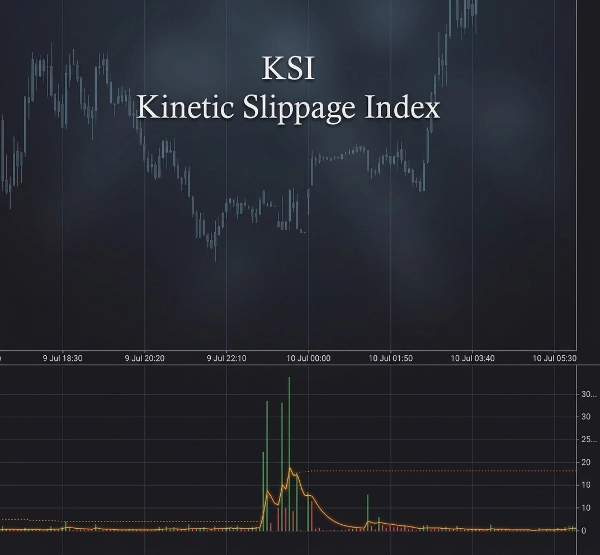
* Berechnet automatisch dynamische Spike-Level basierend auf dem jüngsten Marktverhalten.
* Verwendet statistische Abweichungsanalyse, um extreme Marktereignisse hervorzuheben.
* Passt sich wechselnden Volatilitätsbedingungen an, ohne ständige manuelle Anpassungen zu erfordern.
✅ **Echtzeit-Spike-Warnungen 🚨**
* Erhalten Sie Benachrichtigungen, wenn abnormale Volumen-/Range-Divergenzen auftreten.
* Hilft Tradern, potenzielle Ausbruchbedingungen, Liquiditätszugriffe oder plötzlichen Marktdruck schnell zu erkennen.
✅ **Volumen- & Flussanalyse 📊**
* Verfolgt das aktuelle Volumen im Vergleich zum EMA-Durchschnitt.
* Hebt hervor, wenn die Handelsaktivität ungewöhnlich hoch ist.
* Beinhaltet kumulative Delta-Analyse zur Visualisierung von Kauf- und Verkaufsdruck.
✅ **Signal-Linien-Bestätigung 📈**
* Glatte Signalkalkulation hilft, Veränderungen im KSI-Momentum zu erkennen.
* Grüne/rote Histogramm-Visualisierung macht Marktverschiebungen leicht lesbar.
## 🕒 Handels-Sitzungs-Intelligenz
KSI beinhaltet automatische Markt-Sitzungsverfolgung:
🌏 Asien-Sitzung
🇬🇧 London-Sitzung
🇺🇸 New York AM
☕ New York Mittag
🌆 New York PM
Die integrierte Killzone-Anzeige hilft Tradern zu verstehen, wann Liquidität und Volatilität typischerweise höher sind.
## 📌 Professionelles Informationspanel
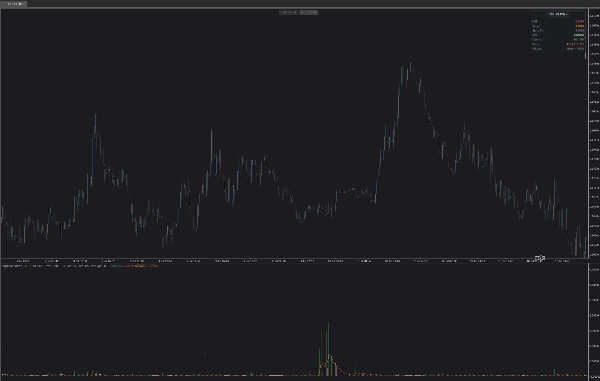
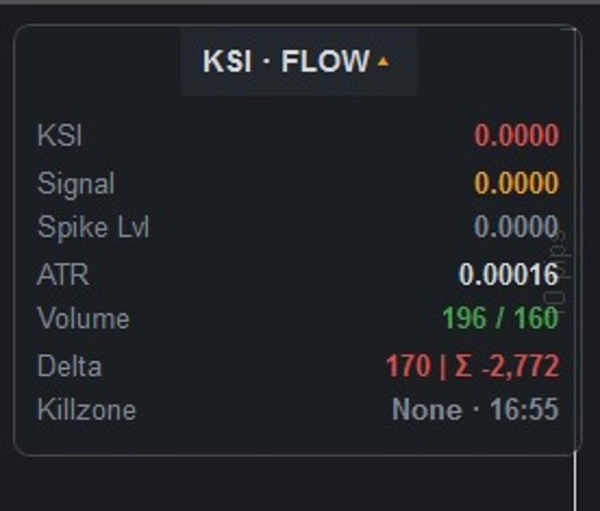
Das integrierte Dashboard bietet eine übersichtliche Darstellung direkt in Ihrem Chart:
📍 Aktueller KSI-Wert
📍 Signal-Level
📍 Adaptiver Spike-Schwellenwert
📍 ATR-Volatilitätsanzeige
📍 Aktuelles Volumen vs. Durchschnittsvolumen
📍 Delta & kumulatives Delta
📍 Aktive Handelssitzung / Killzone
Das Panel kann:
* ✅ In jeder Ecke des Charts positioniert werden
* ✅ Eingeklappt oder erweitert sein
* ✅ Mit benutzerdefinierter Transparenz angepasst werden
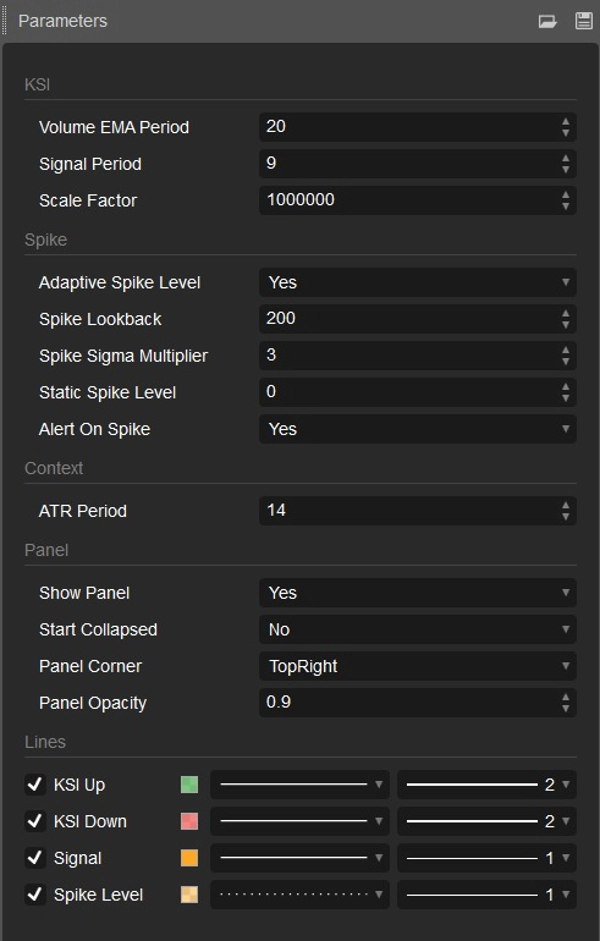
## ⚙️ Anpassbare Einstellungen
Feinabstimmung des KSI für jeden Handelsstil:
🔧 Volumen-EMA-Periode
🔧 Signalperiode
🔧 Skalierungsfaktor
🔧 Adaptive oder feste Spike-Erkennung
🔧 Spike-Rückblickperiode
🔧 Spike-Sensitivitätsmultiplikator
🔧 ATR-Periode
🔧 Einstellungen zum Erscheinungsbild des Panels
## 🎯 Entwickelt für
✔ Forex-Trader
✔ Futures-Trader
✔ Krypto-Trader
✔ Scalper
✔ Daytrader
✔ Marktstruktur-Analysten
✔ Trader, die volumenbasierte Bestätigungen suchen
## 💡 Wie Trader KSI nutzen
KSI kann helfen, zu erkennen:
⚡ Ungewöhnliche Marktaktivität
⚡ Potenziellen Ausbruchs-Druck
⚡ Volumen-Kurs-Divergenz
⚡ Liquiditätsereignisse
⚡ Momentum-Veränderungen
⚡ Handelsmöglichkeiten bei hoher Volatilität
Kombinieren Sie KSI mit Ihrer bestehenden Strategie, um klarer zu erkennen, **wann sich der Markt normal bewegt — und wann etwas Ungewöhnliches passiert.**
📈 Handeln Sie klüger. Verstehen Sie Marktdruck. Entdecken Sie verborgene Aktivitäten mit dem Kinetic Slippage Index.
Zusammenfassung
The indicator includes volume and flow analysis by comparing current volume to its exponential moving average (EMA) and incorporates cumulative delta analysis to visualize buying and selling pressure. A smooth signal line and histogram help confirm changes in KSI momentum, making shifts in market pressure easier to interpret.
KSI tracks major trading sessions—Asia, London, and New York (AM, Lunch, PM)—highlighting periods of higher liquidity and volatility. A professional information panel displays key metrics such as current KSI value, signal level, adaptive spike threshold, ATR volatility, volume comparisons, delta values, and active trading sessions. This panel is customizable in position, size, and opacity.
Settings allow fine-tuning of volume EMA period, signal period, scale factor, spike detection parameters, ATR period, and panel appearance. KSI is suitable for forex, futures, and crypto traders, including scalpers, day traders, and market structure analysts seeking volume-based confirmation and insights into unusual market activity, breakout pressure, liquidity events, and momentum changes.
Diskussion
Kundenbewertungen
5 | 0 % | |
4 | 100 % | |
3 | 0 % | |
2 | 0 % | |
1 | 0 % |
Häufig gestellte Fragen (FAQ)
Mehr von diesem Autor
















Preis