
คำอธิบาย
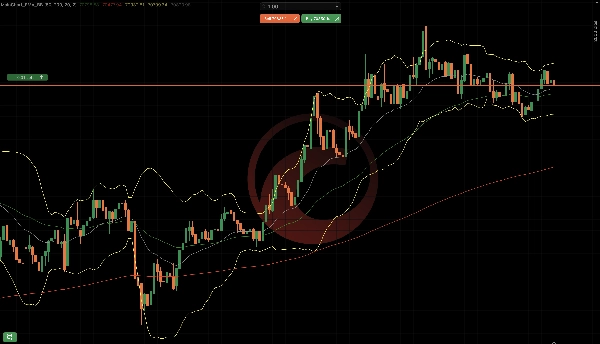
MainChart_EMA_BB เป็น ตัวบ่งชี้ซ้อนแผนภูมิหลัก สำหรับ cTrader ที่รวม:
- ค่าเฉลี่ยเคลื่อนที่แบบทวีคูณ (EMA 50 & EMA 200)
- แถบ Bollinger (บน / กลาง / ล่าง)
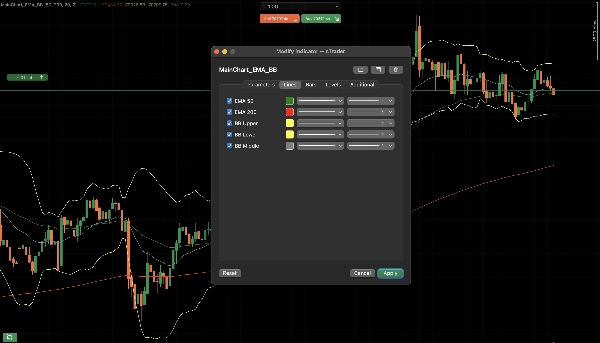
ส่วนประกอบของตัวบ่งชี้
ค่าเฉลี่ยเคลื่อนที่แบบทวีคูณ (EMA)
มี EMA สองตัวให้เลือก:
EMADefault PeriodDefault Color
EMA 50
50
สีเขียว
EMA 200
200
สีแดง
วัตถุประสงค์:
- ทิศทางแนวโน้ม
- แนวรับ/แนวต้านแบบไดนามิก
- EMA 50 อยู่เหนือ EMA 200 → แนวโน้มขาขึ้น
- EMA 50 อยู่ต่ำกว่า EMA 200 → แนวโน้มขาลง
แถบ Bollinger
แถบ Bollinger ประกอบด้วย:
- แถบบน
- แถบกลาง (อิง EMA)
- แถบล่าง
การตั้งค่าเริ่มต้น:
- ช่วงเวลา: 20
- ส่วนเบี่ยงเบนมาตรฐาน: 2.0
- ประเภท MA: แบบทวีคูณ
วัตถุประสงค์:
- การวัดความผันผวน
- โซนซื้อมากเกินไป / ขายมากเกินไป
- ราคาสัมผัสแถบบน → อาจเกิดการอ่อนตัว
- ราคาสัมผัสแถบล่าง → อาจเกิดการเด้งกลับ
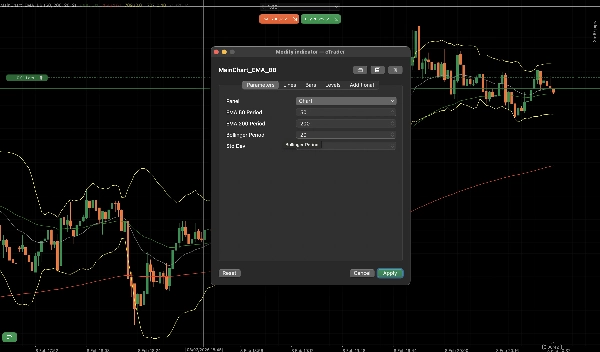
คำอธิบายพารามิเตอร์
พารามิเตอร์ EMA
- แสดง EMA 50: เปิด/ปิด EMA 50
- ช่วงเวลา EMA 50: ช่วงเวลาคำนวณ
- แสดง EMA 200: เปิด/ปิด EMA 200
- ช่วงเวลา EMA 200: ช่วงเวลาคำนวณ
พารามิเตอร์แถบ Bollinger
- แสดงแถบ Bollinger: เปิด/ปิด BB
- ช่วงเวลา BB: ช่วงเวลาย้อนหลัง
- ส่วนเบี่ยงเบนมาตรฐาน BB: ตัวคูณความผันผวน
การใช้งานทั่วไปในการเทรด
การยืนยันแนวโน้ม
- EMA 50 อยู่เหนือ EMA 200
- แนะนำให้เทรดยาวเท่านั้น
การกลับตัว / การดึงกลับ
- ราคาดึงกลับไปที่ EMA 50
- แถบ Bollinger บีบตัวแล้วขยายตัว
ข้อดีของตัวบ่งชี้นี้คือสามารถปรับแต่งได้และไม่จำเป็นต้องตั้งค่าตัวบ่งชี้หลายตัว.
สรุป
โปรไฟล์อินดิเคเตอร์
รีวิวจากลูกค้า
4.5
รีวิว: 2
5 | 50 % | |
4 | 50 % | |
3 | 0 % | |
2 | 0 % | |
1 | 0 % |
รีวิวจากลูกค้า
February 16, 2026
a 1R exit plan makes review easier, and messy areas become easier to avoid.
February 15, 2026
การสนทนา
คำถามที่พบบ่อย
Prop
Forex
Indices
Commodities
Crypto
Stocks
Bollinger
ผลิตภัณฑ์ที่มีให้บริการผ่าน cTrader Store รวมถึงบอทการเทรด อินดิเคเตอร์ และปลั๊กอิน มีให้บริการโดยนักพัฒนาบุคคลที่สามและมีไว้เพื่อวัตถุประสงค์ในการเข้าถึงข้อมูลและทางเทคนิคเท่านั้น cTrader Store ไม่ใช่โบรกเกอร์และไม่ได้ให้คำแนะนำการลงทุน คำแนะนำส่วนบุคคล หรือการรับประกันผลการดำเนินงานในอนาคต
เพิ่มเติมจากผู้เขียนคนนี้

!["[Hamster-Coder] Moving Average MTF" โลโก้](https://cdn.ctrader.com/image/webp/b11b98b1-194d-4b8e-b00e-d611826ad159_31226)
!["High-Low Divergence [Iridio Capital]" โลโก้](https://cdn.ctrader.com/image/webp/443c4661-7abb-40f1-842f-4b6ec560649b_40914)


ราคา
ตั้งแต่ 01/04/2025