
คำอธิบาย
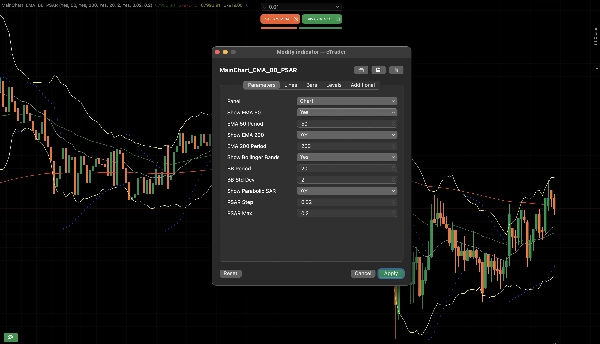
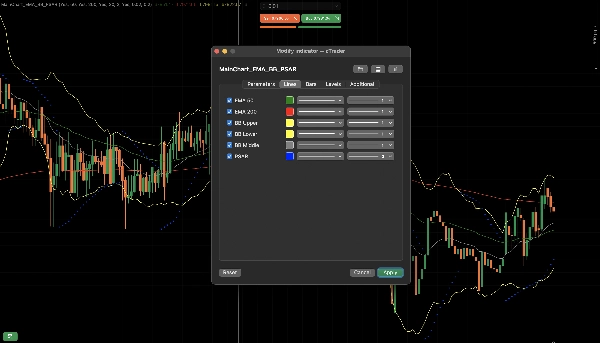
MainChart_EMA_BB_PSAR
วิธีการทำงาน
1. แนวคิดหลัก
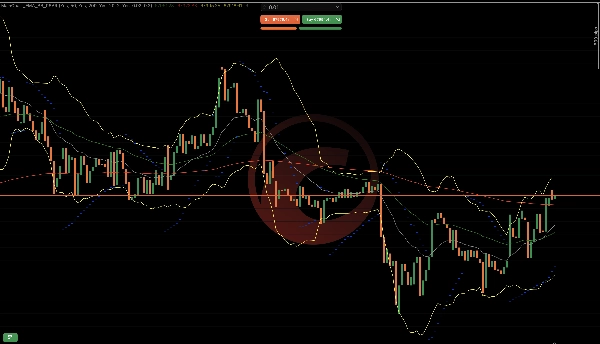
ตัวบ่งชี้นี้รวมตรรกะของแนวโน้ม ความผันผวน และการต่อเนื่องของโมเมนตัมไว้ในชั้นซ้อนเดียว:
EMA 50 & EMA 200 → ทิศทางแนวโน้ม
Bollinger Bands → ความผันผวน & การขยายตัว
Parabolic SAR → การต่อเนื่องของแนวโน้ม & เวลาการกลับตัว
แต่ละส่วนประกอบมีหน้าที่เฉพาะ เมื่อรวมกันจะสร้างกรอบการตัดสินใจที่มีโครงสร้าง
2. ตรรกะ EMA (เครื่องยนต์แนวโน้ม)
สิ่งที่ทำ
คำนวณค่าเฉลี่ยเลขชี้กำลังของราคาปิด
EMA 50 ตอบสนองเร็วกว่า
EMA 200 ตอบสนองช้ากว่า
วิธีการตีความตลาด
ความหมายของเงื่อนไข
EMA 50 อยู่เหนือ EMA 200 แนวโน้มขาขึ้น
EMA 50 อยู่ต่ำกว่า EMA 200 แนวโน้มขาลง
EMA 50 ตัดผ่าน EMA 200 อาจเกิดการเปลี่ยนแปลงแนวโน้ม
ทำไมมันถึงทำงาน
EMA ช่วยให้ราคาละเอียดขึ้นและกรองเสียงรบกวน
ความสัมพันธ์ 50/200 แสดงโมเมนตัมระยะสั้นเทียบกับทิศทางระยะยาว
3. ตรรกะ Bollinger Bands (เครื่องยนต์ความผันผวน)
สิ่งที่ทำ
คำนวณค่าเฉลี่ยเคลื่อนที่ (แถบกลาง)
สร้างแถบบน/ล่างโดยใช้ส่วนเบี่ยงเบนมาตรฐาน
วิธีการตีความตลาด
ความหมายของเงื่อนไข
แถบแคบ ความผันผวนต่ำ (การบีบอัด)
แถบขยาย ความผันผวนสูง (การเคลื่อนไหวแรง)
ราคาสัมผัสแถบด้านนอก อาจเกิดการขยายตัวเกินไป
ทำไมมันถึงทำงาน
ตลาดมีวัฏจักรระหว่างการบีบอัดและการขยายตัว
การเบรคเอาท์มักเกิดหลังจากความผันผวนลดลง
4. ตรรกะ Parabolic SAR (เครื่องยนต์การต่อเนื่อง)
สิ่งที่ทำ
วางจุดเหนือหรือต่ำกว่าราคา
เร่งความเร็วเมื่อแนวโน้มดำเนินต่อไป
วิธีการตีความตลาด
ความหมายของตำแหน่งจุด
ต่ำกว่าราคา แนวโน้มขาขึ้นกำลังทำงาน
สูงกว่าราคา แนวโน้มขาลงกำลังทำงาน
จุดพลิกกลับ อาจเกิดการกลับตัว
ทำไมมันถึงทำงาน
PSAR จะเข้มงวดขึ้นเมื่อแนวโน้มโตเต็มที่ ช่วยติดตามการเคลื่อนไหวและตรวจจับความเหนื่อยล้า
5. วิธีที่ส่วนประกอบทั้งหมดทำงานร่วมกัน
โครงสร้างขาขึ้น
EMA 50 อยู่เหนือ EMA 200
ราคาสูงกว่า EMA 50
PSAR อยู่ต่ำกว่ากราฟแท่งเทียน
Bollinger Bands ขยายขึ้น
→ แสดงถึงโมเมนตัมขาขึ้นที่แข็งแกร่ง
โครงสร้างขาลง
EMA 50 อยู่ต่ำกว่า EMA 200
ราคาต่ำกว่า EMA 50
PSAR อยู่สูงกว่ากราฟแท่งเทียน
Bollinger Bands ขยายลง
→ แสดงถึงโมเมนตัมขาลงที่แข็งแกร่ง
6. การตรวจจับเฟสตลาด
ตัวบ่งชี้นี้ช่วยระบุ 3 เฟสของตลาด:
เฟสแนวโน้ม
EMA เรียงตัว
PSAR สม่ำเสมอ
แถบขยาย
เหมาะสำหรับการเทรดต่อเนื่อง
เฟสบีบอัด
แถบแคบ
EMA แบน
PSAR พลิกบ่อย
ควรรอการเบรคเอาท์
เฟสเปลี่ยนผ่าน
EMA กำลังตัดกัน
PSAR พลิก
แถบขยายกว้างขึ้น
อาจเกิดการกลับตัวในช่วงต้น
7. ตัวอย่างลำดับการทำงานจริง
ตัวอย่างลำดับขาขึ้น:
แถบบีบอัด
แท่งเทียนขาขึ้นแรงทะลุแถบบน
EMA 50 ตัดขึ้นเหนือ EMA 200
PSAR พลิกต่ำกว่าราคา
ลำดับนี้แสดงถึง:
การขยายตัวของความผันผวน
การยืนยันแนวโน้ม
การสนับสนุนการต่อเนื่อง
8. สิ่งที่มันไม่ทำ
ไม่ทำนายข่าว
ไม่รับประกันการกลับตัว
ไม่วัดการไหลของคำสั่งซื้อ
ไม่กำจัดการเบรคเอาท์ปลอม
มันให้การยืนยันที่มีโครงสร้าง ไม่ใช่ความแน่นอน
9. แบบจำลองตรรกะสรุป
ตัวกรองแนวโน้ม → EMA
ตัวกระตุ้นความผันผวน → Bollinger Bands
การจับเวลา & การติดตาม → Parabolic SAR
ทั้งหมดนี้ช่วยลดการเข้าซื้อแบบสุ่มและปรับปรุงการตัดสินใจที่มีโครงสร้าง
สิ่งที่ดีเกี่ยวกับตัวบ่งชี้นี้คือสามารถปรับแต่งได้และไม่จำเป็นต้องตั้งค่าตัวบ่งชี้หลายตัว
สรุป
1. Exponential Moving Averages (EMA 50 and EMA 200) to determine trend direction—EMA 50 reacts faster to price changes, while EMA 200 provides a longer-term trend perspective. The relative position of these EMAs signals bullish or bearish trends and potential trend shifts.
2. Bollinger Bands to measure market volatility and detect phases of compression (low volatility) and expansion (high volatility). Narrow bands indicate potential breakout setups, while price touching outer bands suggests possible overextension.
3. Parabolic SAR to identify trend continuation and reversal timing by plotting dots above or below price, signaling active uptrends or downtrends and potential reversals when dots flip position.
Together, these components form a structured decision framework that helps identify market phases—trending, compression, and transition—and supports confirmation of trend strength and momentum. The indicator is configurable and designed to reduce random entries by combining trend filtering, volatility triggers, and timing signals. It is applicable across various markets including Forex, cryptocurrencies, stocks, commodities, and indices. This tool provides structured confirmation for trading decisions but does not predict news events, guarantee reversals, or eliminate false breakouts.
รีวิวจากลูกค้า
5 | 50 % | |
4 | 50 % | |
3 | 0 % | |
2 | 0 % | |
1 | 0 % |


