
Beschreibung
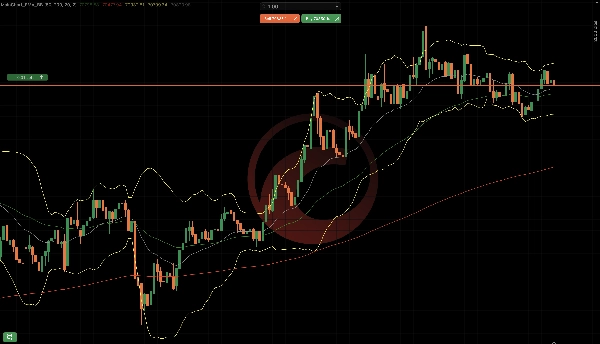
MainChart_EMA_BB ist ein Hauptchart-Overlay-Indikator für cTrader, der kombiniert:
- Exponentielle gleitende Durchschnitte (EMA 50 & EMA 200)
- Bollinger-Bänder (Obere / Mittlere / Untere)
Indikator-Komponenten
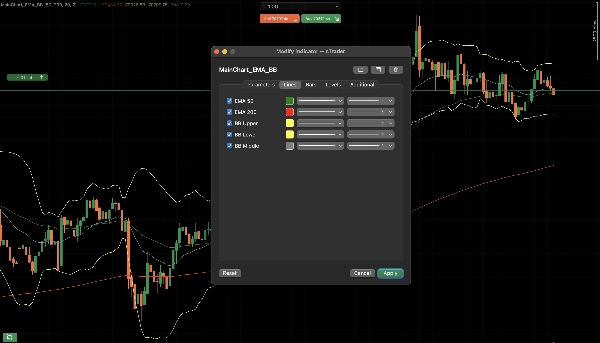
Exponentielle gleitende Durchschnitte (EMA)
Zwei EMAs sind verfügbar:
EMA Standardperiode Standardfarbe
EMA 50
50
Grün
EMA 200
200
Rot
Zweck:
- Trendrichtung
- Dynamische Unterstützung/Widerstand
- EMA 50 über EMA 200 → bullische Tendenz
- EMA 50 unter EMA 200 → bärische Tendenz
Bollinger-Bänder
Bollinger-Bänder bestehen aus:
- Oberes Band
- Mittleres Band (EMA-basiert)
- Unteres Band
Standardeinstellungen:
- Periode: 20
- Standardabweichung: 2,0
- MA-Typ: Exponentiell
Zweck:
- Volatilitätsmessung
- Überkaufte / überverkaufte Zonen
- Preis berührt oberes Band → mögliche Erschöpfung
- Preis berührt unteres Band → mögliche Gegenbewegung
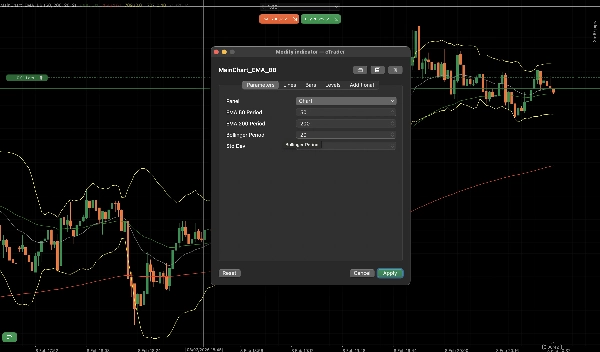
Parameter erklärt
EMA-Parameter
- EMA 50 anzeigen: EMA 50 ein-/ausschalten
- EMA 50 Periode: Berechnungsperiode
- EMA 200 anzeigen: EMA 200 ein-/ausschalten
- EMA 200 Periode: Berechnungsperiode
Bollinger-Bänder-Parameter
- Bollinger-Bänder anzeigen: BB ein-/ausschalten
- BB Periode: Rückblickperiode
- BB Std Abw: Volatilitätsmultiplikator
Typische Handelsanwendung
Trendbestätigung
- EMA 50 über EMA 200
- Bevorzugt nur Long-Trades
Umkehr / Rücksetzer
- Preis zieht zurück zur EMA 50
- Bollinger-Band-Verengung gefolgt von Ausdehnung
Gut an diesem Indikator ist, dass er konfigurierbar ist und keine Einrichtung mehrerer Indikatoren erforderlich ist.
Zusammenfassung
Indikatorprofil
Kundenbewertungen
4.5
Bewertungen: 2
5 | 50 % | |
4 | 50 % | |
3 | 0 % | |
2 | 0 % | |
1 | 0 % |
Kundenbewertungen
February 16, 2026
a 1R exit plan makes review easier, and messy areas become easier to avoid.
February 15, 2026
Diskussion
Häufig gestellte Fragen (FAQ)
Prop
Forex
Indices
Commodities
Crypto
Stocks
Bollinger
Über den cTrader Store verfügbare Produkte, einschließlich Handelsbots, Indikatoren und Plugins, werden von externen Entwicklern bereitgestellt und nur zu Informations- und technischen Zugriffszwecken verfügbar gemacht. cTrader Store ist kein Broker und erbringt keine Anlageberatung, persönlichen Empfehlungen oder eine Garantie für zukünftige Performance.
Mehr von diesem Autor


Preis
Seit 01/04/2025