
Descrizione
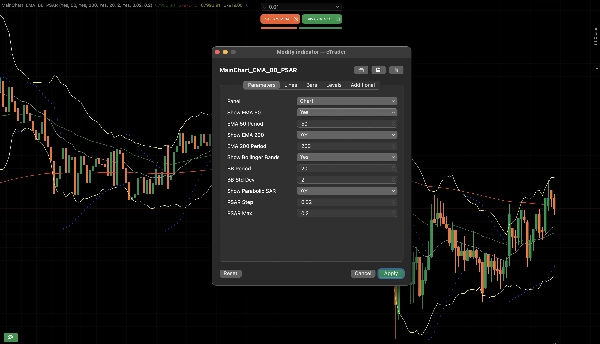
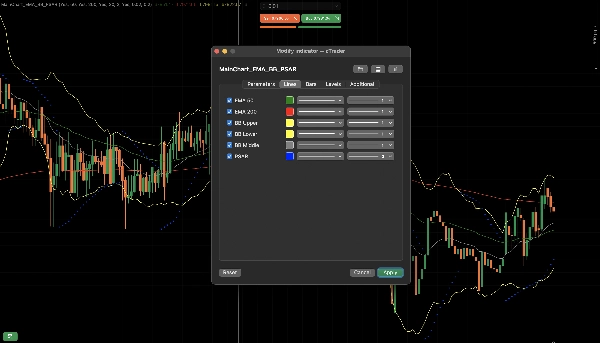
MainChart_EMA_BB_PSAR
Come Funziona
1. Concetto Base
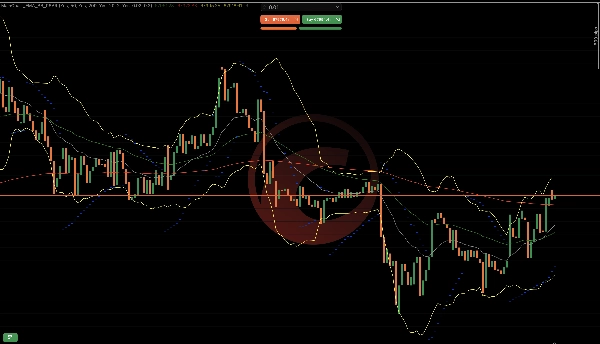
Questo indicatore combina la logica di trend, volatilità e continuazione del momentum in un unico sovrapposto:
EMA 50 & EMA 200 → Direzione del trend
Bande di Bollinger → Volatilità & espansione
Parabolic SAR → Continuazione del trend & tempistica di inversione
Ogni componente svolge una funzione specifica. Insieme, formano un quadro decisionale strutturato.
2. Logica EMA (Motore del Trend)
Cosa Fa
Calcola medie esponenziali dei prezzi di chiusura.
EMA 50 reagisce più velocemente.
EMA 200 reagisce più lentamente.
Come Interpreta il Mercato
Significato della Condizione
EMA 50 sopra EMA 200 Trend rialzista
EMA 50 sotto EMA 200 Trend ribassista
EMA 50 incrocia EMA 200 Possibile inversione di trend
Perché Funziona
EMA smussa il prezzo e filtra il rumore.
La relazione 50/200 mostra il momentum a breve termine rispetto alla direzione a lungo termine.
3. Logica Bande di Bollinger (Motore della Volatilità)
Cosa Fa
Calcola la media mobile (banda centrale)
Costruisce bande superiore/inferiore usando la deviazione standard
Come Interpreta il Mercato
Significato della Condizione
Bande strette Bassa volatilità (compressione)
Bande si espandono Alta volatilità (movimento forte attivo)
Prezzo tocca banda esterna Potenziale sovraestensione
Perché Funziona
I mercati ciclicamente passano tra compressione ed espansione.
I breakout spesso avvengono dopo una contrazione della volatilità.
4. Logica Parabolic SAR (Motore di Continuazione)
Cosa Fa
Traccia punti sopra o sotto il prezzo.
Accelera man mano che il trend continua.
Come Interpreta il Mercato
Significato della Posizione del Punto
Sotto il prezzo Trend rialzista attivo
Sopra il prezzo Trend ribassista attivo
Cambio di punto Possibile inversione
Perché Funziona
Il PSAR si stringe man mano che il trend matura, aiutando a seguire i movimenti e a rilevare l’esaurimento.
5. Come Funzionano Insieme Tutti i Componenti
Struttura Rialzista
EMA 50 sopra EMA 200
Prezzo sopra EMA 50
PSAR sotto le candele
Bande di Bollinger in espansione verso l’alto
→ Indica un forte momentum rialzista
Struttura Ribassista
EMA 50 sotto EMA 200
Prezzo sotto EMA 50
PSAR sopra le candele
Bande di Bollinger in espansione verso il basso
→ Indica un forte momentum ribassista
6. Rilevamento della Fase di Mercato
Questo indicatore aiuta a identificare 3 fasi di mercato:
Fase di Trend
EMA allineate
PSAR coerente
Bande in espansione
Ideale per operazioni di continuazione.
Fase di Compressione
Bande strette
EMA piatta
PSAR che cambia frequentemente
Meglio aspettare un breakout.
Fase di Transizione
Incrocio EMA in formazione
Cambio PSAR
Bande che si allargano
Potenziale inversione precoce.
7. Esempio Pratico di Flusso
Esempio di sequenza rialzista:
Compressione delle bande
Candela rialzista forte rompe la banda superiore
EMA 50 incrocia sopra EMA 200
PSAR cambia sotto il prezzo
Questa sequenza mostra:
Espansione della volatilità
Conferma del trend
Supporto alla continuazione
8. Cosa NON Fa
Non prevede le notizie
Non garantisce inversioni
Non misura il flusso degli ordini
Non elimina i falsi breakout
Fornisce conferma strutturata, non certezza.
9. Modello Logico Riassuntivo
Filtro del Trend → EMA
Trigger di Volatilità → Bande di Bollinger
Tempistica & Inseguimento → Parabolic SAR
Insieme, riducono ingressi casuali e migliorano il processo decisionale strutturato.
Il vantaggio di questo indicatore è che è configurabile e non c’è bisogno di impostare più indicatori.
Riepilogo
1. Exponential Moving Averages (EMA 50 and EMA 200) to determine trend direction—EMA 50 reacts faster to price changes, while EMA 200 provides a longer-term trend perspective. The relative position of these EMAs signals bullish or bearish trends and potential trend shifts.
2. Bollinger Bands to measure market volatility and detect phases of compression (low volatility) and expansion (high volatility). Narrow bands indicate potential breakout setups, while price touching outer bands suggests possible overextension.
3. Parabolic SAR to identify trend continuation and reversal timing by plotting dots above or below price, signaling active uptrends or downtrends and potential reversals when dots flip position.
Together, these components form a structured decision framework that helps identify market phases—trending, compression, and transition—and supports confirmation of trend strength and momentum. The indicator is configurable and designed to reduce random entries by combining trend filtering, volatility triggers, and timing signals. It is applicable across various markets including Forex, cryptocurrencies, stocks, commodities, and indices. This tool provides structured confirmation for trading decisions but does not predict news events, guarantee reversals, or eliminate false breakouts.
Recensioni dei clienti
5 | 50 % | |
4 | 50 % | |
3 | 0 % | |
2 | 0 % | |
1 | 0 % |

![Logo di "[Stellar Strategies] Smart ADX"](https://cdn.ctrader.com/image/webp/af13b084-b6f6-41db-b7bc-c7e688b57b05_36929)


