sarah trend
Chỉ báo
111 lượt tải
Phiên bản 1.0, Apr 2025
Windows, Mac
5.0
Đánh giá: 1
Mô tả
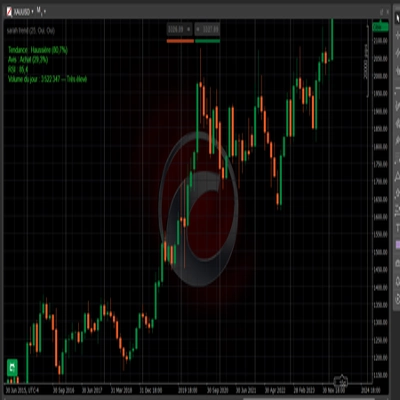
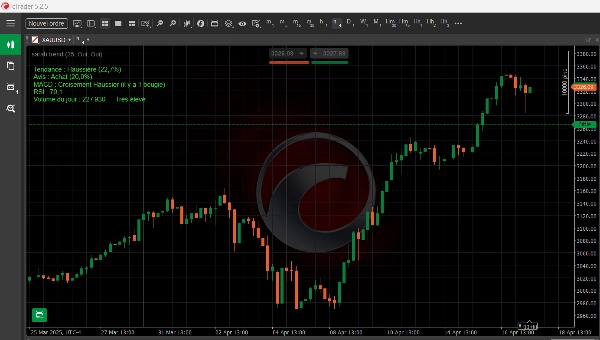
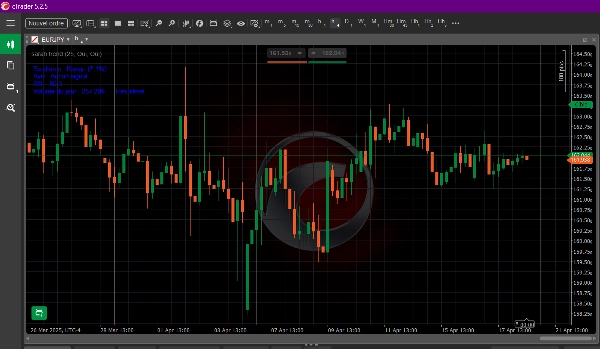
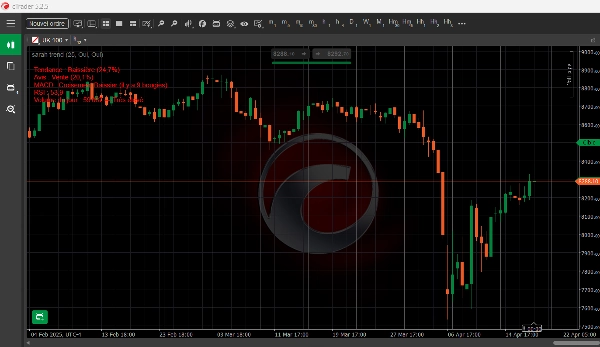
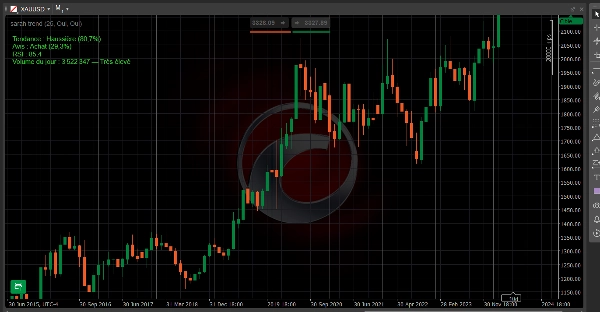
Chỉ báo Xu hướng Đơn giản — Công cụ đa năng để phát hiện các cơ hội giao dịch tốt nhất
Chỉ báo mạnh mẽ này kết hợp ADX, RSI, MACD và khối lượng hàng ngày để cung cấp cho bạn một cái nhìn rõ ràng và ngay lập tức về thị trường:
✅ Phát hiện xu hướng theo thời gian thực: tăng, giảm hoặc đi ngang
✅ Hiển thị đánh giá rõ ràng (mua/bán) dựa trên sức mạnh của xu hướng
✅ Tích hợp tín hiệu cắt ngang MACD gần đây để xác nhận điểm vào lệnh
✅ Hiển thị mức khối lượng hàng ngày để ước lượng sự cam kết của thị trường
✅ Tùy chọn hiển thị hoặc không hiển thị RSI và MACD, tùy theo phong cách giao dịch của bạn
🔍 Sử dụng trên bất kỳ tài sản hoặc khung thời gian nào để tinh chỉnh quyết định và tăng sự tự tin trong các vị thế của bạn.
Tóm tắt
Tóm tắt AI
Sarah Trend is a comprehensive trend indicator that integrates ADX, RSI, MACD, and daily volume data to provide a clear, real-time market analysis. It detects market trends—bullish, bearish, or ranging—and offers straightforward buy or sell signals based on trend strength. The indicator incorporates recent MACD crossover signals to validate entry points and displays daily volume levels to assess market engagement. Users can customize the display of RSI and MACD components according to their trading preferences. Suitable for any asset and timeframe, Sarah Trend aims to support traders in refining decisions and enhancing confidence in their positions.
Hồ sơ chỉ báo
Đánh giá của khách hàng
5.0
Đánh giá: 1
5 | 100 % | |
4 | 0 % | |
3 | 0 % | |
2 | 0 % | |
1 | 0 % |
Thảo luận
Câu hỏi thường gặp
RSI
MACD
Các sản phẩm có sẵn trên cTrader Store, bao gồm bot giao dịch, chỉ báo và plugin, được cung cấp bởi các nhà phát triển bên thứ ba và chỉ nhằm mục đích cung cấp thông tin và tiếp cận kỹ thuật. cTrader Store không phải là nhà môi giới và không cung cấp lời khuyên đầu tư, khuyến nghị cá nhân hay bất kỳ đảm bảo nào về hiệu suất trong tương lai.


![Logo "[CB] Pivot Points Pro"](https://cdn.ctrader.com/image/webp/43463c82-67b0-4f10-a4ba-901bba091d81_32594)


![Logo "[Stellar Strategies] Inside Bar with Signals"](https://cdn.ctrader.com/image/webp/1d9e8bfa-3b2c-4440-bb37-5856902008a7_30683)


Giá
Kể từ 15/01/2025
351
Cài đặt miễn phí