
Description
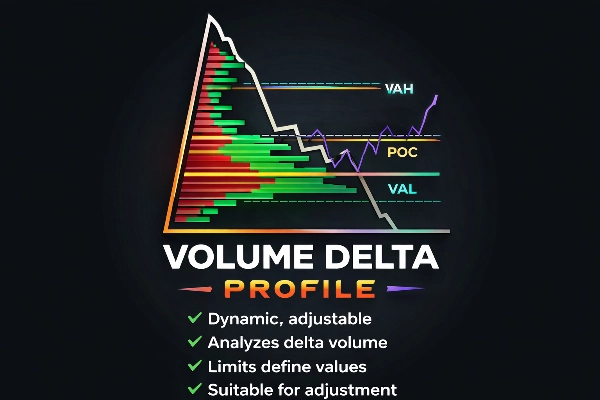
Profil Delta de Volume
Analyse professionnelle du flux d’ordres pour traders avancés
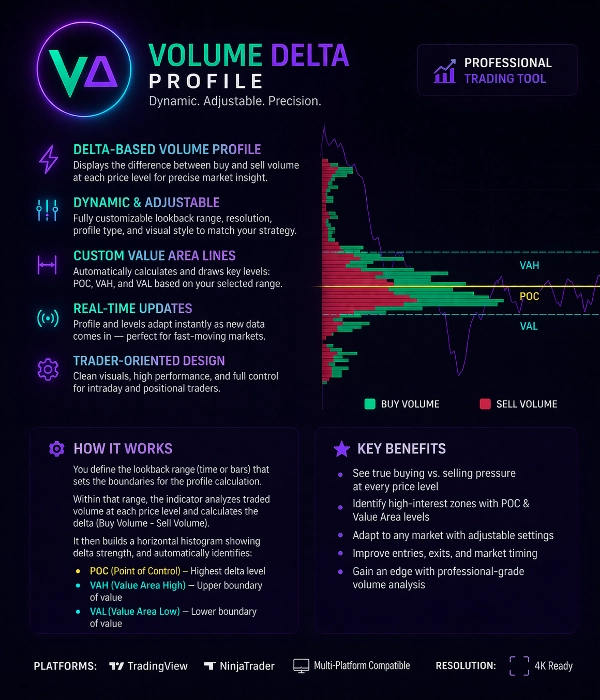
Le Profil Delta de Volume est un outil de trading puissant conçu pour révéler le véritable équilibre entre acheteurs et vendeurs à chaque niveau de prix.
Contrairement aux profils de volume traditionnels, cet indicateur analyse le Delta de Volume (Volume d’Achat – Volume de Vente) pour montrer où les participants agressifs dominent le marché.
Il aide les traders à identifier l’activité institutionnelle, les zones d’absorption et les niveaux de prix à fort intérêt avec précision.
Fonctionnalités principales
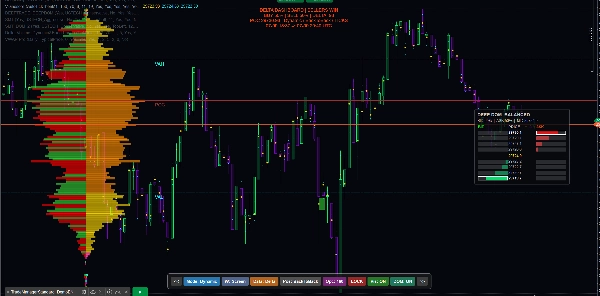
Profil de volume basé sur le Delta
L’indicateur calcule le delta de volume à chaque niveau de prix, en séparant :
• Pression d’achat agressive
• Pression de vente agressive
Cela révèle qui contrôle réellement le marché.
Plage de profil dynamique et ajustable
La plage de calcul du profil est entièrement personnalisable.
Les utilisateurs peuvent définir la zone de calcul par :
• Plage de barres personnalisée
• Plage de session
• Sélection manuelle
• Plage dynamique glissante
Le profil se met automatiquement à jour à mesure que de nouvelles données arrivent.
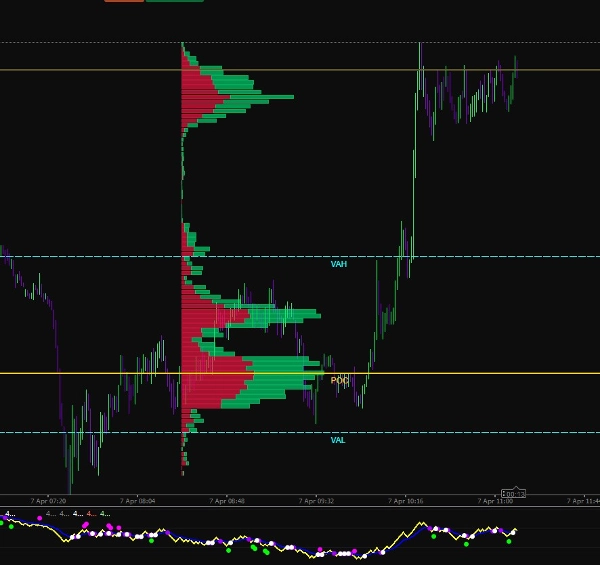
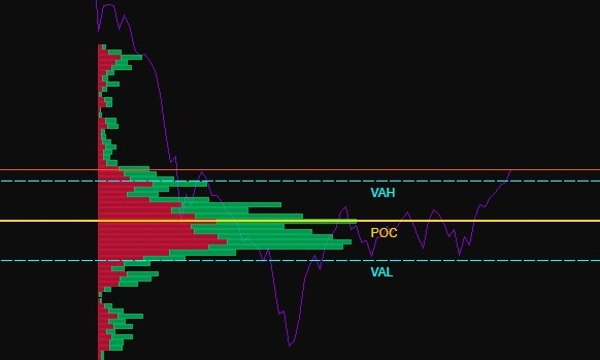
Détection de la zone de valeur
L’indicateur calcule automatiquement les niveaux clés de la structure du marché :
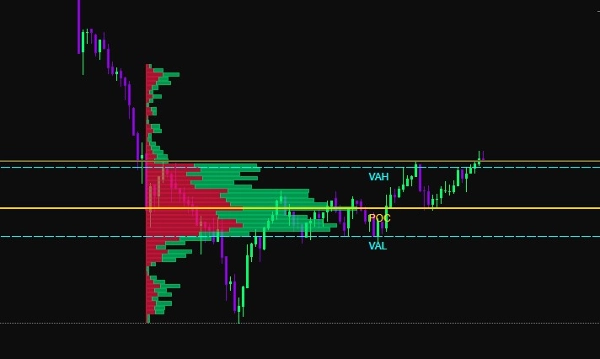
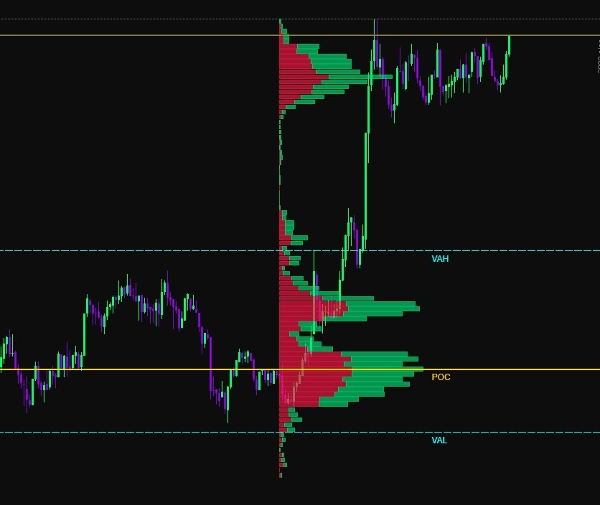
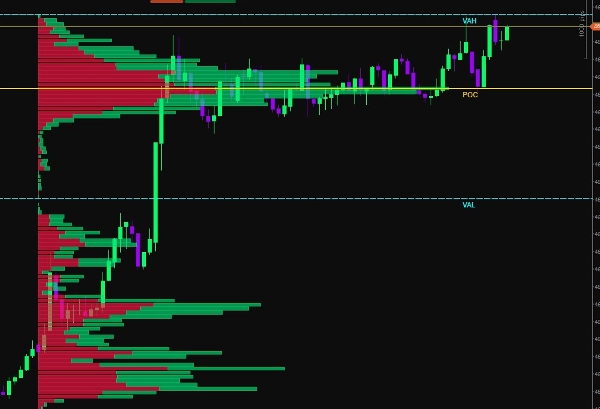
POC (Point de Contrôle)
Le niveau de prix avec le plus grand volume delta échangé.
VAH (Valeur Haute)
Limite supérieure de la zone de valeur.
VAL (Valeur Basse)
Limite inférieure de la zone de valeur.
Ces niveaux mettent en évidence où la majorité de l’activité du marché s’est produite.
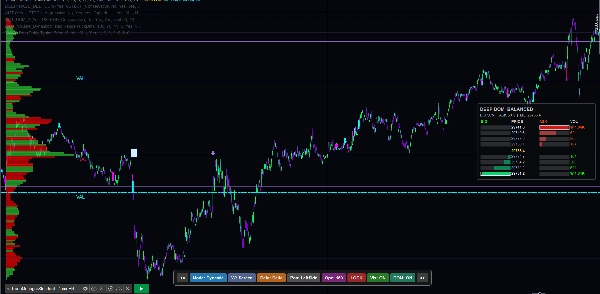
Visualisation Achat vs Vente
Le volume est affiché sous forme de histogramme horizontal :
Barres vertes → Volume d’achat dominant
Barres rouges → Volume de vente dominant
Cela permet aux traders de voir instantanément :
• Zones d’absorption
• Zones de déséquilibre
• Clusters de liquidité
• Empreintes institutionnelles
Visualisation adaptative
L’indicateur inclut plusieurs options de personnalisation visuelle :
• Largeur d’histogramme ajustable
• Schémas de couleurs personnalisés
• Transparence ajustable
• Contrôle de la résolution
• Rendu adaptatif au zoom
Cela garantit une visualisation claire sur tous les intervalles de temps du graphique.
Niveaux de frontière intelligents
L’indicateur trace des niveaux de référence dynamiques :
• Ligne POC
• Ligne VAH
• Ligne VAL
Ces niveaux se mettent à jour automatiquement en fonction de la plage de profil sélectionnée et peuvent être utilisés comme :
• Support / Résistance
• Zones de reversion vers la moyenne
• Niveaux de confirmation de cassure
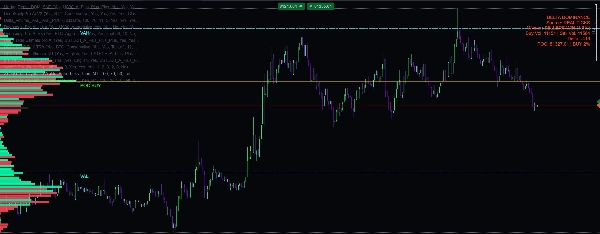
Calcul en temps réel
Le Profil Delta de Volume se recalcule en continu en utilisant les données de marché en direct.
Cela garantit que les traders voient toujours des informations sur le flux d’ordres à jour lors des marchés rapides.
Cas d’utilisation
Cet outil est idéal pour :
• Scalping
• Trading intrajournalier
• Trading de futures
• Analyse du flux d’ordres
• Suivi de la liquidité
• Détection des empreintes institutionnelles
Avantages clés pour le trading
✔ Identifier la vraie pression d’achat vs vente
✔ Détecter les zones d’absorption et d’épuisement
✔ Localiser les niveaux de haute liquidité
✔ Améliorer la précision des entrées
✔ Confirmer les cassures ou retournements
✔ Comprendre la structure du marché
Spécifications techniques
Méthode de calcul :
Delta Volume = Volume d’Achat − Volume de Vente
Type de profil :
Histogramme horizontal des niveaux de prix
Niveaux automatiques :
POC, VAH, VAL
Mode de mise à jour :
Mise à jour dynamique en temps réel
Paramètres personnalisés :
• Plage de profil
• Résolution de l’histogramme
• Échelle de volume
• Paramètres de couleur
• Visibilité des niveaux
Compatibilité plateforme :
Optimisé pour un rendu graphique haute performance
Conçu pour les traders professionnels
Le Profil Delta de Volume est conçu pour les traders qui souhaitent aller au-delà des indicateurs basiques et comprendre les véritables mécanismes du marché.
En combinant analyse de volume, calcul du delta et structure de la zone de valeur, cet outil offre une vue claire de la participation au marché et de la distribution de la liquidité.
Résumé
Users can customize the profile calculation range using options such as custom bar range, session range, manual selection, or rolling dynamic range, with real-time updates as new market data arrives. Key market structure levels—Point of Control (POC), Value Area High (VAH), and Value Area Low (VAL)—are automatically calculated and drawn as dynamic reference lines, useful for support/resistance, mean reversion, and breakout confirmation.
Additional features include adjustable histogram width, color schemes, transparency, resolution control, and zoom-adaptive rendering for clear visualization across all chart timeframes. The tool supports use cases like scalping, intraday trading, futures trading, order flow analysis, liquidity tracking, and institutional footprint detection. It is optimized for high-performance chart rendering and aims to provide traders with precise insights into market participation and liquidity distribution.


