"PulseTracker" logo
PulseTracker
"PulseTracker" uploaded image
Since 21/02/2025
461.42M
Traded volume
178.3K
Pips won
10
Sales
5.76K
Free installs

Unlock Precision Trading with Our Revolutionary Trend Tracking Technology

BrickAlgo TrendTracker is the ultimate trend identification indicator designed specifically for cTrader. This powerful technical tool helps you spot key market reversals with ease, providing clear visual signals for optimal entry and exit points.

Key Features:

  • Dynamic Trend Detection: Identifies trend changes based on price action analysis
  • Visual Signal System: Color-coded arrows show bullish and bearish trend shifts
  • Performance Tracking: Optional pip value display shows profit/loss between signals
  • Customizable Settings: Adjust parameters to match your trading style and timeframe
  • Clean Chart Interface: Overlay design keeps your charts clutter-free

How It Works:

BrickAlgo TrendTracker analyzes price movements by comparing current values against smoothed averages of high and low prices. When a significant pattern change is detected, the indicator generates a signal, helping you identify potential trend reversals before they become obvious to other traders.


Here’s a concise explanation of how to use the indicator:

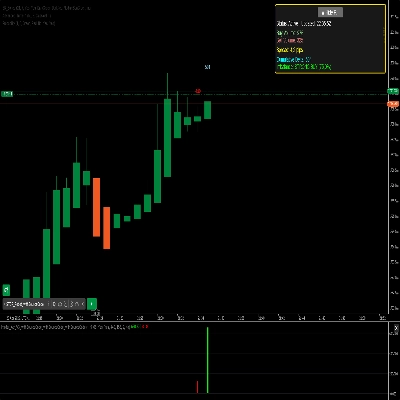
  1. Load the Indicator: Add the indicator to your chart from the indicators menu in cTrader.
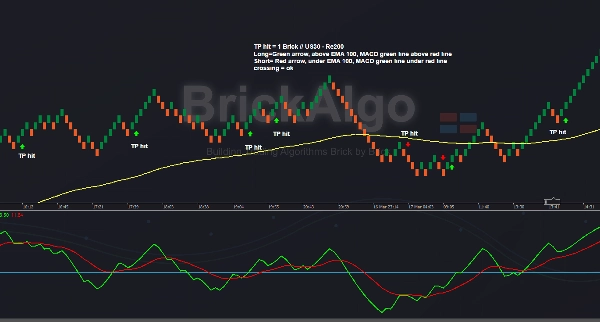
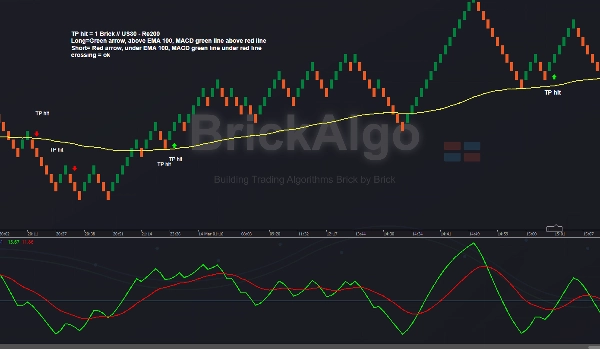
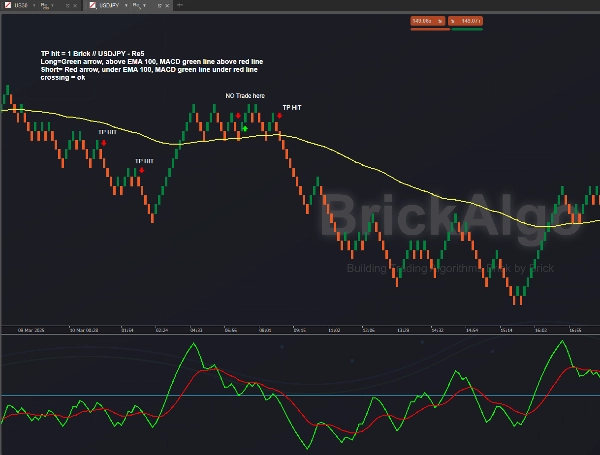
  2. Use Renko Chart (e.g., Re5): Ensure you are using a Renko chart, such as Re5, which is just an example. The indicator works with different brick sizes. Personally, I trade USDJPY on Re5 and US30 on Re100 and Re200 with this indicator.
  3. Adjust Settings: Refer to the provided screenshots for the recommended indicator settings.
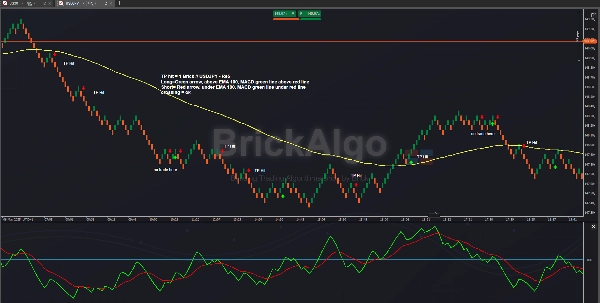
  4. Filter Signals: For better trade confirmation, use MACD as shown in the screenshots, HTF confirmation, Support & Resistance, EMA, or other BrickAlgo indicators like BrickAlgo TrendPulse.
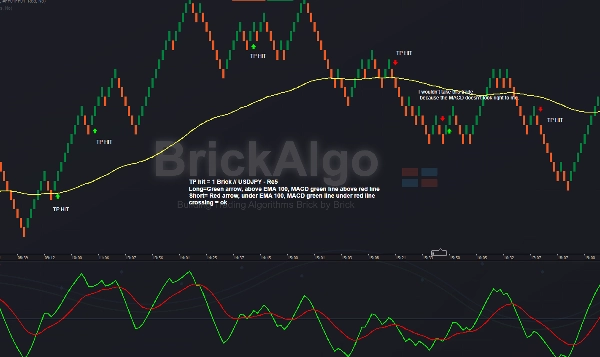
  5. TP & SL: I use 1 brick size for Take Profit (TP), while Stop Loss (SL) is variable, usually between 1 and 3 bricks.

I personally prefer to trade USDJPY on the Re5 chart and use a 100 EMA and MACD, as shown in the screenshots. I use BrickAlgo TrendPulse to take additional trades.

Indicator profile
0.0
Reviews: 0
Customer reviews
No reviews for this product yet. Already tried it? Be the first to tell others!
Signal
MACD
USDJPY
Products available through cTrader Store, including trading bots, indicators and plugins, are provided by third-party developers and made available for informational and technical access purposes only. cTrader Store is not a broker and does not provide investment advice, personal recommendations or any guarantee of future performance.

More from this author

High-probability trading signals in the fast-paced world of forex and CFD trading.
High-Performance Renko Chart Indicator with Advanced filtering method.
This indicator combines RSI (Relative Strength Index) with volume analysis to generate more reliable trading signals.
Automatic Elliott Wave Detection with Professional Filters
The Renko Moving Average Cross indicator combines classic EMA crossover signals with Renko-filtered prices.
Enhance Your Trading Strategy with the Larry Williams 9-5-3 Indicator
Engulfing Pattern Indicator
MA-RSI HTF Confirmation: Eliminate false signals and trade with confidence!
🚀 Simplify Your Trading Decisions With Powerful Technical Analysis.
PinBarCandlestickPattern Indicator
Hammer Pattern Indicator
Breakout Multi-Timeframe Strategy Indicator

You may also like

Single-line JPY Strength Indicator: Track yen momentum swiftly across key pairs—achieve clarity in your forex trades!
Advanced RSI Indicator with multi-MA smoothing, Bollinger Bands, divergence detection, and fill zones for cTrader.
Trend Sniper — session-based tool highlighting live session ranges and adaptive Custom line.
🔍 MultiScalpScorePRO – Powerful real-time scoring system combining indicators for ultra-precise scalping signals.
Plots intraday VWAP and dynamic ±1/±2 standard deviation (SD) bands based on current day’s price and volume.
Automatically detects and marks higher highs, lower highs, lower lows and higher lows.Check the other version in my page
Draw a rectangle, label it RRL or RRS. Instant position size, risk, reward targets and full R:R breakdown.
Smart institutional order block & FVG scanner with alerts, zone merging, and HTF confluence.
TrendEngine — The Dual Workflow is not “another trend color.”
Custom period EMA
Pivot-based Support and Resistance levels that extend until broken, with volume-confirmed break signals
Draws Stoploss and Takeprofit levels based on the ATR indicator.
Automatically plots fractal high and low lines on your chart so you always have clean, reliable structure levels.
Three ZigZag lines
AxiomPoint: Professional momentum tracker using triple-phase filtering logic for precise trend entry points.
Volume distribution analysis with Market Profile TPO integration.
OHLC PRO – Advanced Session & Market Structure Tool
DEMO VERSION 7 DAYS VolumeProfileSuite is an advanced and flexible Volume Profile indicator for cTrader.
Since 21/02/2025
461.42M
Traded volume
178.3K
Pips won
10
Sales
5.76K
Free installs