
Opis
📈 Wskaźnik Divergency v1.1 dla cTrader: Kompleksowy przewodnik 🚀
Wskaźnik Divergency v1.1 to potężne narzędzie zaprojektowane dla platformy cTrader, służące do identyfikacji dywergencji i korelacji między ruchem cen a różnymi oscylatorami. Ten przewodnik zawiera szczegółowy opis kodu, jego funkcjonalności oraz instrukcje krok po kroku, jak skutecznie z niego korzystać. Niezależnie od tego, czy jesteś początkującym, czy doświadczonym traderem, ten wskaźnik może wzbogacić Twoją analizę techniczną dzięki konfigurowalnym ustawieniom i wizualnym wskazówkom. Zanurzmy się! 🌟
🎯 Przegląd wskaźnika Divergency11
Wskaźnik Divergency v1.1 analizuje ruchy cen i zachowanie oscylatora, aby wykryć:
- Regularne dywergencje: Sygnały potencjalnych odwróceń, gdy cena i wskaźnik poruszają się w przeciwnych kierunkach.
- Ukryte dywergencje: Wskazują kontynuację trendu, gdy cena i wskaźnik różnie się ze sobą zgadzają.
- Korelacje: Podkreślają, gdy cena i wskaźnik poruszają się synchronicznie, sugerując siłę trendu.
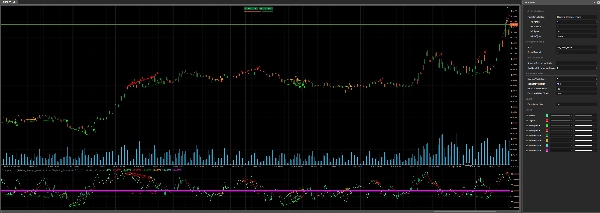
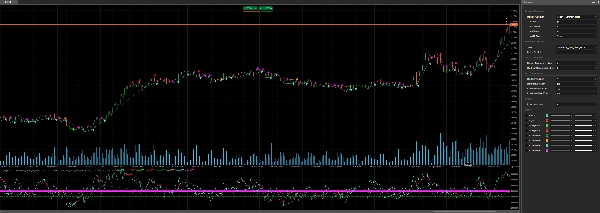
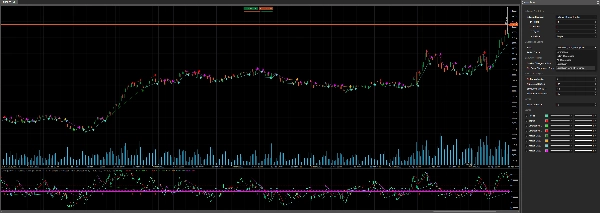
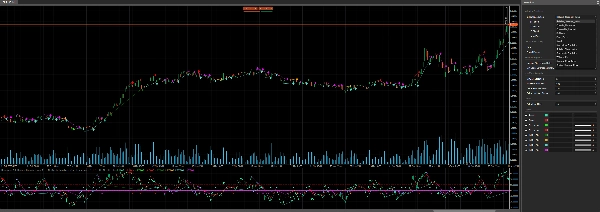
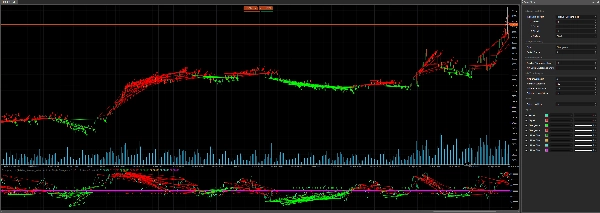
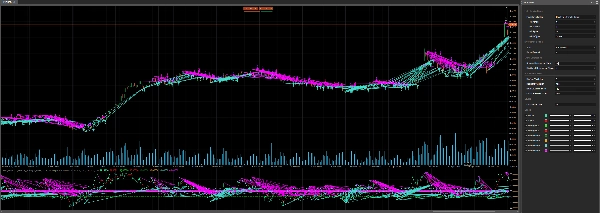
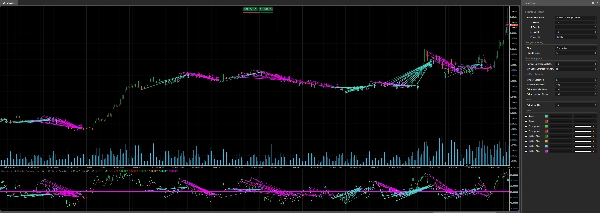
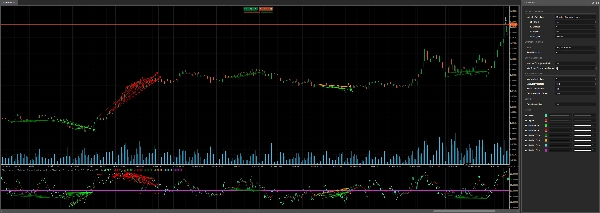
Obsługuje 12 różnych oscylatorów (np. RSI, MACD, Stochastic) i pozwala na dostosowanie parametrów wykrywania dywergencji, co czyni go wszechstronnym dla różnych strategii handlowych. Wskaźnik wyświetla sygnały bezpośrednio na wykresie i w obszarze wskaźnika, używając kolorowych linii, ikon i tekstu dla jasnej wizualizacji. 📊
🔍 Analiza kodu
1. Konfiguracja wskaźnika 🛠️
- Namespace i klasa: Zdefiniowane w przestrzeni nazw
cAlgojakoDivergency v1.1, dziedziczące poIndicator. - Atrybuty:
-
IsOverlay = false: Wyświetla się w osobnym oknie wskaźnika.TimeZone = TimeZones.UTC: Używa UTC dla spójności.AccessRights = AccessRights.None: Nie wymaga specjalnych uprawnień.
2. Parametry ⚙️
Wskaźnik oferuje szerokie możliwości dostosowania poprzez parametry, pogrupowane dla przejrzystości:
- Wybór oscylatora:
-
IndicatorSelection: Wybierz spośród 12 oscylatorów (np. RSI, MACD, Stochastic). (Normalizowane do 50 jako środek, a wynik wyższy dla procesu optymalizacji)Value1,Value2,Value3: Dostosuj ustawienia okresu, wygładzania i linii sygnału.MaType: Wybierz typ średniej kroczącej (np. prosta, wykładnicza).
- Ustawienia dywergencji:
-
Strat: Wybierz tryb wykrywania (Dywergencja, Ukryta dywergencja, Korelacja lub kombinacje).PeriodFractal: Ustaw okres fraktala do identyfikacji szczytów/dolin (musi być nieparzysty).LookBack: Liczba historycznych dywergencji do analizy.MinCountDivergenceShow: Minimalna liczba dywergencji wymagana do wyświetlenia sygnałów.
- Analiza stref:
-
MinBarsValidation,MaxBarsValidation: Definiuje zakres ważnych świec do wykrywania dywergencji.ExtraLevelMin,ExtraLevelMax: Ustawia progi wykupienia/wyprzedania oscylatora.
- Poziomy:
-
ExtraLevelLine: Dostosowuje linie wykupienia/wyprzedania wokół poziomu 50.
3. Wyniki 📈
Result: Główna wartość oscylatora (zielona linia).Signal: Wygładzona linia sygnału (czerwona linia).- Sygnały dywergencji (wykreslane jako punkty):
-
ResDivergenceUp(Lime),ResDivergenceDown(Czerwony): Regularne dywergencje.ResDivergenceUpHidden(Zielony),ResDivergenceDownHidden(Pomarańczowy): Ukryte dywergencje.ResCorrelationUp(Turkusowy),ResCorrelationDown(Magenta): Korelacje.
4. Kluczowe funkcje 🧠
- Initialize(): Konfiguruje wskaźnik, waliduje parametry i rysuje statyczne linie (wykupienie, wyprzedanie, zero).
- Calculate(): Oblicza wartości oscylatora, normalizuje je wokół 50 i wykrywa fraktale do analizy dywergencji.
- GetFractal(): Identyfikuje szczyty (fractalUp) i dołki (fractalDown) w oscylatorze.
- GetDivergence(): Analizuje punkty fraktalne, aby wykryć dywergencje lub korelacje.
- CreateLine(): Rysuje linie trendu i ikony dla wykrytych sygnałów.
- DawDivergence(): Wizualizuje dywergencje za pomocą linii i strzałek na wykresie i w obszarze wskaźnika.
5. Klasy pomocnicze 📋
SRPrice: Przechowuje dane fraktalne (indeks, cena, wartość wskaźnika).DivergenceFind: Śledzi szczegóły dywergencji (tytuł, czas, ceny, kolor).
6. Obsługa błędów 🚨
Wskaźnik sprawdza nieprawidłowe parametry (np. MinBarsValidation > MaxBarsValidation, parzysty PeriodFractal) i wyświetla ostrzeżenia w obszarze wskaźnika za pomocą DrawStaticText.
🛠️ Jak korzystać ze wskaźnika Divergency11
Krok 1: Instalacja 📥
- Pobierz kod: Skopiuj dostarczony kod C#.
- Dodaj do cTrader:
-
- Otwórz cTrader i przejdź do cAlgo > Indicators.
- Kliknij New i wklej kod do edytora.
- Zbuduj wskaźnik (upewnij się, że nie ma błędów kompilacji).
- Zastosuj na wykresie:
-
- Otwórz wykres w cTrader.
- Dodaj wskaźnik Divergency11 z listy wskaźników.
Krok 2: Konfiguracja parametrów ⚙️
Dostosuj ustawienia do swojego stylu handlu:
- Wybierz oscylator:
-
- Wybierz oscylator (np.
Relative_Strenght_Indexdla RSI) za pomocąIndicatorSelection. - Dostosuj
Value1(okres),Value2(wygładzanie) iValue3(okres sygnału) według potrzeb.
- Wybierz oscylator (np.
- Ustaw typ dywergencji:
-
- Użyj
Strat, aby skupić się naDivergence,Hiden_Divergence,CorrelationlubAll_Divergence.
- Użyj
- Fraktal i Lookback:
-
- Ustaw
PeriodFractalna liczbę nieparzystą (np. 5) dla symetrii. - Dostosuj
LookBack, aby kontrolować, ile historycznych dywergencji jest analizowanych.
- Ustaw
- Strefy i poziomy:
-
- Skonfiguruj
ExtraLevelMiniExtraLevelMaxdla stref wykupienia/wyprzedania. - Ustaw
ExtraLevelLine, aby dostosować progi wizualne.
- Skonfiguruj
Krok 3: Interpretacja sygnałów 📊
- Regularna dywergencja:
-
- W górę (Lime): Sygnał niedźwiedzi (cena robi wyższe szczyty, oscylator niższe szczyty).
- W dół (Czerwony): Sygnał byczy (cena robi niższe dołki, oscylator wyższe dołki).
- Ukryta dywergencja:
-
- W górę (Zielony): Kontynuacja bycza (cena robi niższe szczyty, oscylator wyższe szczyty).
- W dół (Pomarańczowy): Kontynuacja niedźwiedzia (cena robi wyższe dołki, oscylator niższe dołki).
- Korelacja:
-
- W górę (Turkusowy): Silny trend byczy (cena i oscylator rosną).
- W dół (Magenta): Silny trend niedźwiedzi (cena i oscylator spadają).
- Wskazówki wizualne:
-
- Linie trendu łączą punkty dywergencji na wykresie i wskaźniku.
- Strzałki wskazują kierunek sygnału (w górę/w dół).
- Tekst wyświetla liczbę wykrytych dywergencji (jeśli
LookBack > 1).
Krok 4: Strategie handlowe 💡
- Trading odwrócenia:
-
- Używaj regularnych dywergencji (Lime/Czerwony) do wykrywania potencjalnych odwróceń.
- Potwierdzaj innymi wskaźnikami (np. wsparcie/opór, formacje świecowe).
- Kontynuacja trendu:
-
- Ukryte dywergencje (Zielony/Pomarańczowy) sygnalizują kontynuację trendu.
- Wchodź w transakcje zgodnie z kierunkiem trendu po cofnięciu.
- Siła trendu:
-
- Korelacje (Turkusowy/Magenta) potwierdzają silne trendy.
- Używaj jako filtru, aby unikać transakcji przeciwnych do trendu.
- Interwał czasowy:
-
- Działa na dowolnym interwale, ale wyższe interwały (H1, H4) redukują szumy.
- Zarządzanie ryzykiem:
-
- Ustaw stop-lossy poniżej ostatnich dołków (dla pozycji długich) lub powyżej szczytów (dla krótkich).
- Używaj ATR (zawartego w kodzie) do określania wielkości pozycji.
Krok 5: Optymalizacja 🔧
- Backtest: Użyj funkcji testowania wstecznego cTrader, aby przetestować wskaźnik na danych historycznych.
- Dostosuj parametry: Eksperymentuj z
PeriodFractal,LookBackiMinCountDivergenceShow, aby zmniejszyć fałszywe sygnały. - Łączenie wskaźników: Łącz z wskaźnikami trendu (np. średnie kroczące) lub narzędziami zmienności (np. Bollinger Bands).
🌟 Wskazówki na sukces
- Zacznij prosto: Zacznij od domyślnych ustawień i znanego oscylatora, takiego jak RSI.
- Ćwicz na demo: Testuj wskaźnik na koncie demo, aby zrozumieć jego sygnały.
- Monitoruj alerty: Obserwuj strzałki i linie trendu, aby szybko reagować na sygnały.
- Unikaj nadmiernego handlu: Używaj dywergencji jako części szerszej strategii, nie izolowanie.
- Bądź na bieżąco: Sprawdzaj aktualizacje kodu lub opinie społeczności na forach cTrader.
⚠️ Typowe problemy i rozwiązania
- Brak sygnałów:
-
- Sprawdź
MinCountDivergenceShowwzględemLookBack(pierwszy musi być ≤ drugiego). - Upewnij się, że
PeriodFractaljest nieparzysty.
- Sprawdź
- Zbyt wiele sygnałów:
-
- Zwiększ
MinCountDivergenceShowlub zmniejszLookBack. - Zaostrz
MinBarsValidationiMaxBarsValidation.
- Zwiększ
- Komunikaty o błędach:
-
- Przejrzyj ostrzeżenia parametrów w obszarze wskaźnika (np.
MinBarsValidation > MaxBarsValidation). - Popraw nieprawidłowe ustawienia i ponownie zastosuj wskaźnik.
- Przejrzyj ostrzeżenia parametrów w obszarze wskaźnika (np.
🎉 Podsumowanie
Wskaźnik Divergency v1.1 to wszechstronne i solidne narzędzie dla użytkowników cTrader, oferujące głębokie spojrzenie na relacje między ceną a oscylatorem. Dzięki konfigurowalnym ustawieniom i czytelnym wizualizacjom pozwala traderom z pewnością wykrywać odwrócenia, kontynuacje i siłę trendu. Wypróbuj, dostosuj parametry i włącz go do swojego planu handlowego, aby podnieść jakość analizy! 🚀
Szczęśliwego handlu i niech Twoje wykresy zawsze będą zielone! 📈💚
Podsumowanie
- Regular divergences signaling potential reversals when price and oscillator move oppositely.
- Hidden divergences indicating trend continuation with differing price and oscillator alignments.
- Correlations highlighting synchronized movements suggesting trend strength.
Signals are displayed on the chart and indicator window using colored lines, icons, and text for clarity. Visual cues include trend lines connecting divergence points and arrows indicating signal direction. Key functions handle initialization, calculation of normalized oscillator values, fractal detection, divergence analysis, and drawing of signals.
Users can configure overbought/oversold zones and adjust lookback periods to tailor signal sensitivity. The indicator works on any timeframe, with higher timeframes recommended to reduce noise. It includes error handling for invalid parameters and provides guidance for installation, parameter setup, signal interpretation, and trading strategies such as reversal and trend continuation. Backtesting and parameter optimization are supported within cTrader to refine performance.
Opinie klientów
5 | 100 % | |
4 | 0 % | |
3 | 0 % | |
2 | 0 % | |
1 | 0 % |


