
Mô tả
Chỉ báo dựa trên việc phân tích diễn biến giá 📈 để xác định những thay đổi trong cấu trúc thị trường và các khu vực quan trọng. Dưới đây là tóm tắt chi tiết về cách hoạt động của nó:
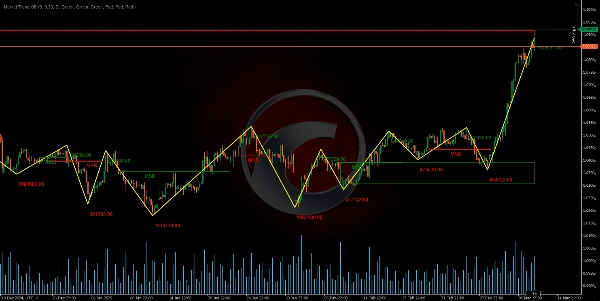
Phát hiện các điểm Pivot và hình thành Zigzag 🔄
Một khoảng thời gian cụ thể (được xác định bởi tham số độ dài) được phân tích để xác định các đỉnh và đáy tương đối. Bằng cách so sánh giá trong khoảng thời gian đó, các điểm pivot (điểm uốn) được phát hiện, từ đó tạo thành mô hình zigzag ⚡. Mô hình này giúp phân biệt khi nào xảy ra đảo chiều giá.
Tích lũy khối lượng và tính toán độ lệch 📊
Trong quá trình phát hiện pivot, khối lượng tick được tích lũy trong đoạn được đánh giá. Ngoài ra, sự khác biệt phần trăm giữa các giá pivot được tính toán để xác định xem chuyển động có đủ quan trọng hay không. Độ lệch này được so sánh với ngưỡng đã định, giúp xác nhận rằng sự thay đổi trong cấu trúc là thật sự ✅.
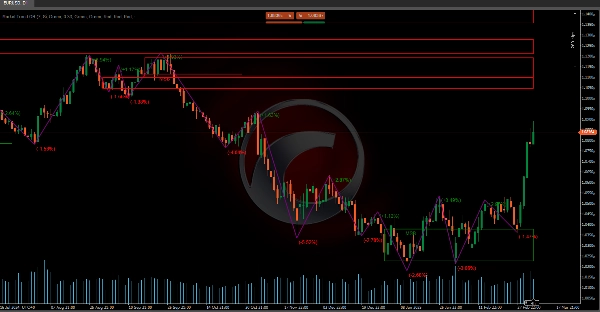
Định nghĩa về Phá vỡ Cấu trúc Thị trường (MSB) 🚨
Chỉ báo đánh giá hai điểm pivot cuối cùng (dù là đỉnh hay đáy) và, bằng cách áp dụng hệ số thoái lui (lấy cảm hứng từ các mức Fibonacci), xác định xem có xảy ra phá vỡ cấu trúc hay không.
- Nếu, sau khi phá vỡ đỉnh cũ, giá bắt đầu tạo ra đáy thấp hơn, một sự chuyển đổi sang cấu trúc giảm giá được xác định 🐻.
- Tương tự, nếu sau khi phá vỡ đáy cũ, giá tạo ra đỉnh cao hơn, một sự chuyển đổi sang cấu trúc tăng giá được giả định 🐂.
Sự thay đổi này được hiểu là Phá vỡ Cấu trúc Thị trường (MSB).
Xác định các Khối Lệnh và Hộp Phá vỡ 📦
Khi một MSB được phát hiện, các vùng quan trọng được xác định dựa trên diễn biến giá trước đó:
- Khối Lệnh (OB) 🧱: Đây là các vùng được xác định là nơi diễn ra hành động quan trọng cuối cùng trước khi phá vỡ. Trong cấu trúc giảm giá, cây nến tăng giá cuối cùng trước đỉnh mới được lấy; trong cấu trúc tăng giá, cây nến giảm giá cuối cùng trước đáy mới được sử dụng.
- Hộp Phá vỡ (BB) 📈: Những vùng này được xác định tương tự nhưng xem xét thêm phạm vi để xác nhận rằng giá đã phá vỡ mức trước đó.
Những vùng này giúp xác định các khu vực nơi hoạt động tập trung và có thể đóng vai trò là hỗ trợ hoặc kháng cự trong tương lai.
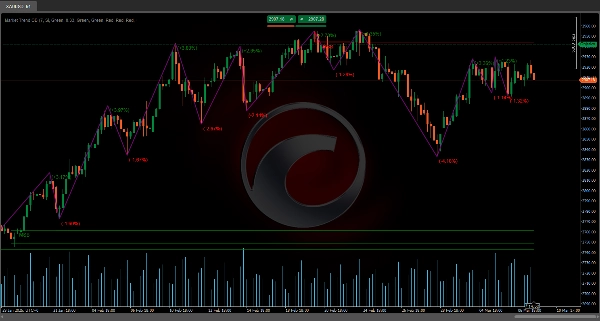
Hiển thị dữ liệu Zigzag liên quan 📊
Ngoài việc vẽ chuỗi các điểm pivot, chỉ báo còn tích hợp thêm dữ liệu:
- Giá đảo chiều 💹: Giá trị chính xác nơi phát hiện sự thay đổi xu hướng được ghi lại.
- Thay đổi phần trăm đảo chiều 🔄: Tính toán sự biến động phần trăm giữa giá pivot mới và giá pivot trước đó, cho thấy mức độ thay đổi.
- Khối lượng tích lũy 📉: Tổng khối lượng tick trong đoạn dẫn đến việc hình thành pivot được hiển thị.
Dữ liệu này cho phép đánh giá sức mạnh và tính liên quan của chuyển động mà không dựa trên giả định, vì nó dựa trên các phép tính cụ thể.
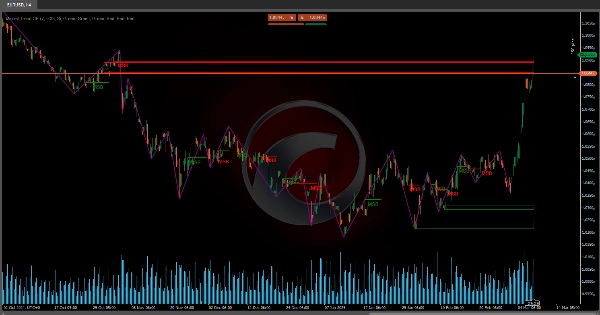
Tóm lại, công cụ phân tích diễn biến giá để phát hiện khi thị trường thay đổi xu hướng (MSB) và xác định các vùng (khối lệnh và hộp phá vỡ) có thể là chìa khóa cho quyết định giao dịch 💼. Việc tích hợp mô hình zigzag với phân tích khối lượng và độ lệch phần trăm cung cấp cái nhìn toàn diện về cấu trúc thị trường, mang lại thông tin chính xác về điểm đảo chiều và sức mạnh của chuyển động 💪.
Các chỉ báo Ctrader Store:
Cấu trúc Thị trường Động
Phân tích các Điểm Quay
Fibonacci Tuyến tính
Hồi quy Đa khung thời gian
Định hướng Nến đa cấp
Theo dõi
Trình theo dõi Cực điểm Zig-Zag
Tự động Hỗ trợ và
Đường xu hướng Kháng cự
Tóm tắt
It defines Market Structure Breaks (MSB) by evaluating recent pivots with a retracement factor inspired by Fibonacci levels. A break in structure is signaled when price action shifts from higher highs to lower lows (bearish) or from lower lows to higher highs (bullish).
Upon detecting an MSB, the indicator identifies critical zones: Order Blocks (OB), representing the last significant candle before a breakout, and Breakout Boxes (BB), which confirm price level breaches with an additional range. These zones serve as potential future support or resistance areas.
The tool visualizes relevant zigzag data, including reversal prices, percentage changes, and accumulated volume, enabling assessment of movement strength and relevance based on concrete calculations. This comprehensive approach integrates zigzag patterns, volume analysis, and deviation metrics to provide precise information on reversal points and market movement strength, supporting informed trading decisions.
Đánh giá của khách hàng
5 | 100 % | |
4 | 0 % | |
3 | 0 % | |
2 | 0 % | |
1 | 0 % |


