present
Sign up and get $50 off your first purchase
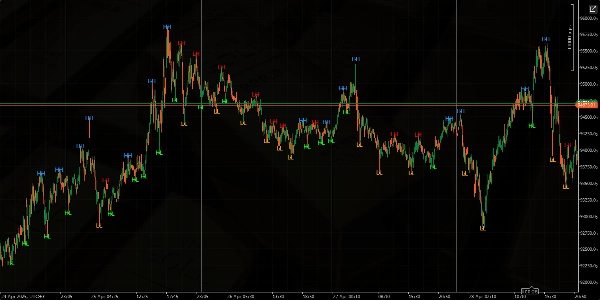
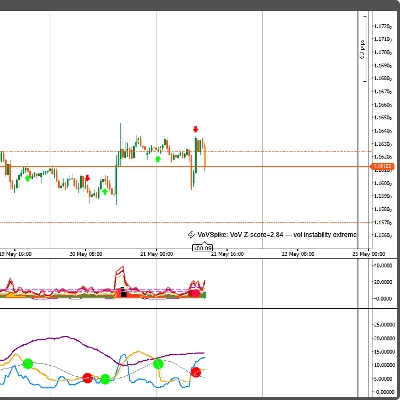
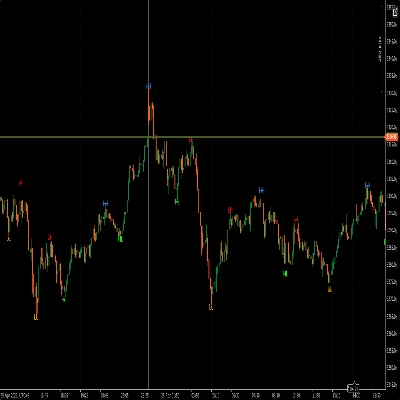
Trading product for Higher Highs Lower Lows Indicator, image 1
Higher Highs Lower Lows
Indicator
47 downloads
Version 1.0, Apr 2025
Windows, Mac
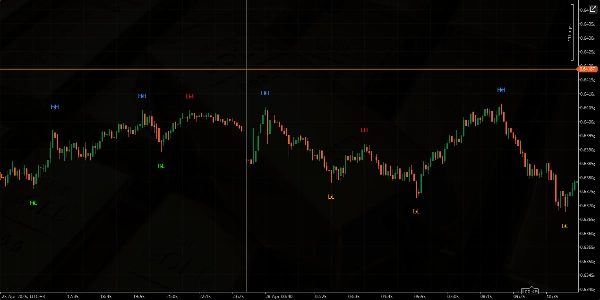
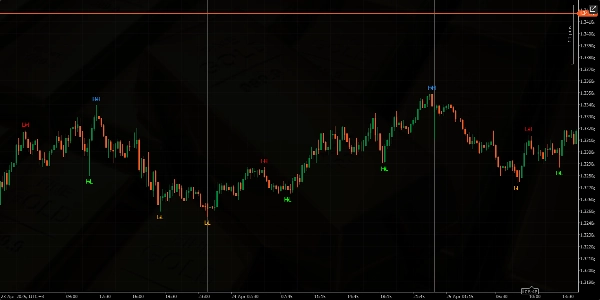
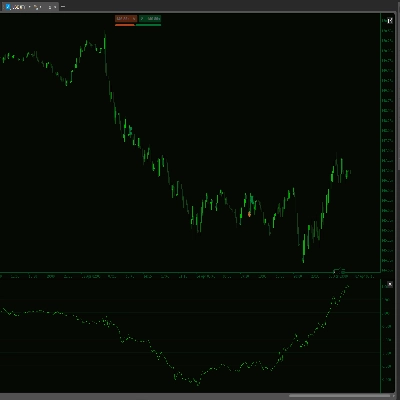
Trading product for Higher Highs Lower Lows Indicator, image 2
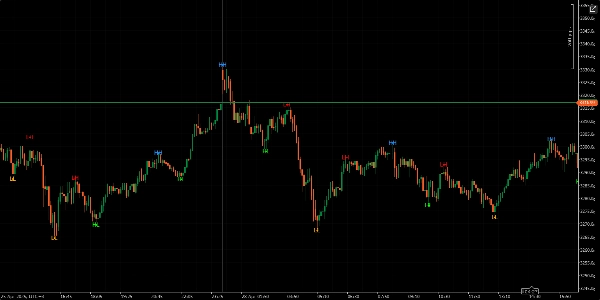
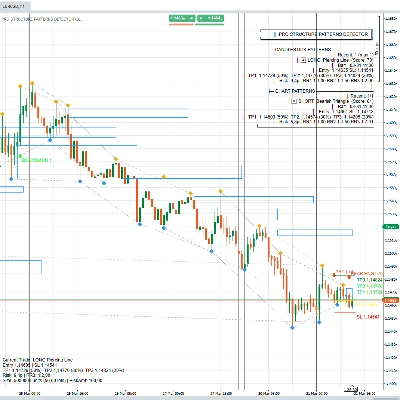
Trading product for Higher Highs Lower Lows Indicator, image 3
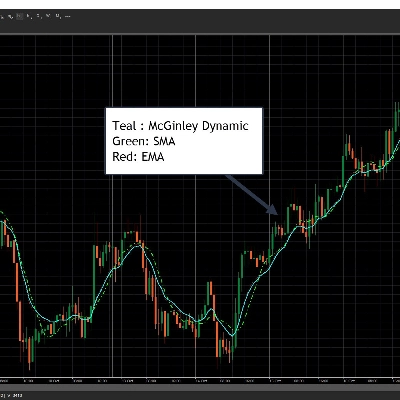
Trading product for Higher Highs Lower Lows Indicator, image 4
Trading product for Higher Highs Lower Lows Indicator, image 5
Since 16/03/2025
256
Free installs

Description

Summary

AI summary
Higher Highs Lower Lows is a technical indicator designed to automatically detect and mark key market structure points on trading charts. It identifies and highlights higher highs, lower highs, higher lows, and lower lows, which are fundamental elements in analyzing price trends and market momentum. This indicator assists traders by visually marking these critical price levels, facilitating the assessment of market direction and potential trend reversals. It can be applied across various markets and timeframes to support technical analysis. Installation of the indicator enables automatic market structure recognition without manual plotting.
Indicator profile

Customer reviews

0.0
Reviews: 0
Customer reviews
No reviews for this product yet. Already tried it? Be the first to tell others!

Discussion

FAQ

Products available through cTrader Store, including trading bots, indicators and plugins, are provided by third-party developers and made available for informational and technical access purposes only. cTrader Store is not a broker and does not provide investment advice, personal recommendations or any guarantee of future performance.

More from this author
Indicator
ATR
RSI
+8
The WaveTrend Indicator is a multifunctional oscillator designed to center the trend wave or movements in the trend.

You may also like

Indicator
Forex
BTCUSD
+11
Next-gen Volume Oscillator using Hyperbolic Tangent math. No repainting. Includes arrows, alerts, and overlay mode 🎯
Indicator
BOS
MSS
+3
Orderblocks with Multi-Timeframe.
Indicator
ADX
ATR
+5
Scored breakouts of sloped pivot trendlines: four filters on the break bar, ATR stop, 1:1 / 1:2 / 1:3 targets, alerts.
Indicator
ATR
RSI
+14
A metric that can set 1 to 3 groups of Bollinger Bands
Indicator
Prop
Forex
+11
A visual indicator designed to help traders identify and track market activity across different trading sessions.
Indicator
ADX
ATR
+5
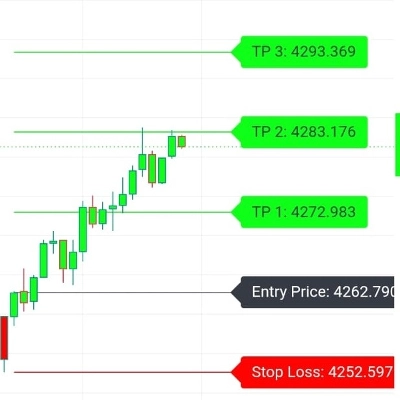
Range-filter BUY/SELL flips with an ATR or swing stop, three targets, five confluence stars and a live panel
Indicator
AI
SMC
+4
Weekly Daily Opening Gaps — NWOG & NDOG Indicator Professional-grade opening gap visualization for institutional traders
Indicator
AI
Forex
+5
Whale Hunting Indicator
Indicator
Volume
Moving Average
Multi-Timeframe Rolling Volatility Indicator - Smart Volatility Breakout System
Indicator
ATR
RSI
+5
Supply and demand zones with break of structure, higher timeframe MA signals, a percent stop and three targets.
Indicator
Forex
EURUSD
+3
US Dollar Index
Indicator
Forex
BTCUSD
+12
Pro Structure Patterns Detector
Indicator
Forex
EURUSD
+1
Designed to follow price more naturally, adjusting automatically to market speed, to reduce lag and false signals.
Indicator
Signal
Breakout
+1
Bolliger Bands + Hamster-Coder™ Timeframe Decoupling
Indicator
SMC
Forex
+5
The only cTrader FVG indicator with Breakaway Gap detection, mitigation tracking, and full multi-asset compatibility.
Indicator
ATR
EMA
+4
Range-filter BUY/SELL signals scored by four confluence layers, with a stop, five targets and a trend panel
Indicator
VWAP
Volume
+4
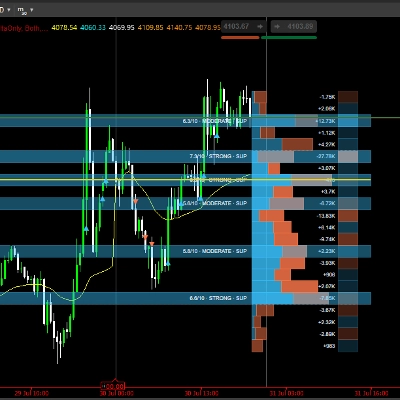
Advanced Order Flow & Volume Profiling for cTrader. Unveil institutional footprints, Delta, and Anchored VWAPs.
Indicator
Supply & Demand
Support & Resistance
Trade With Smile Indicator is a professional trading indicator designed to help traders identify potential market trends

Price

Since 16/03/2025
256
Free installs