
WAVETREND_withSourceCode
Indikator
Version 1.0, Oct 2025
Windows, Mac
5.0
Bewertungen: 2
Beschreibung
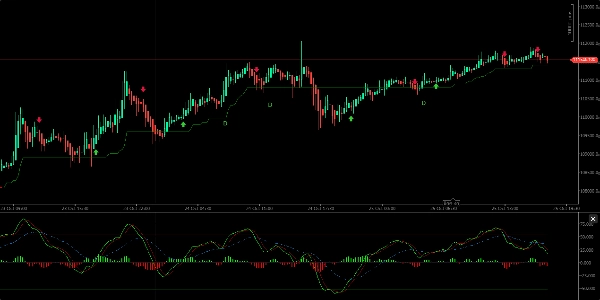
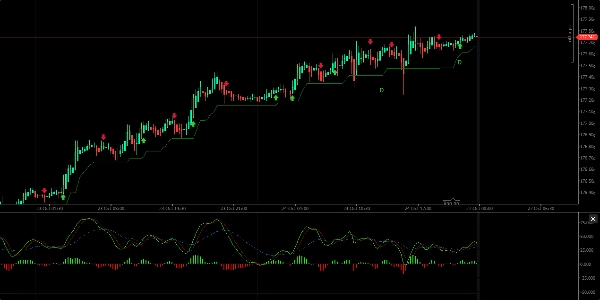
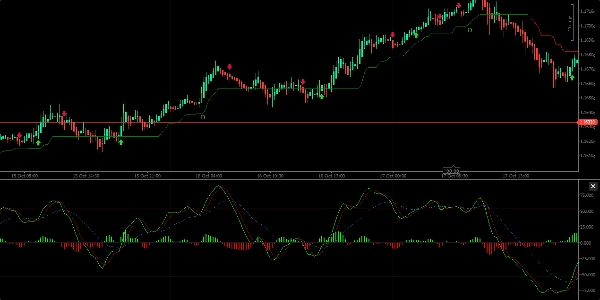
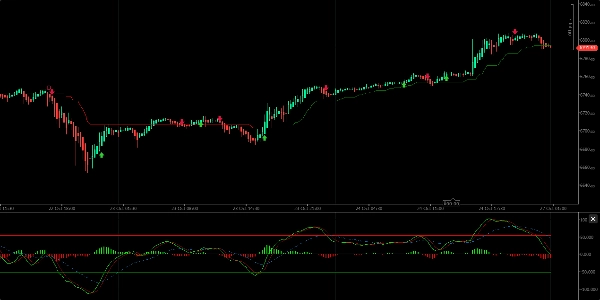
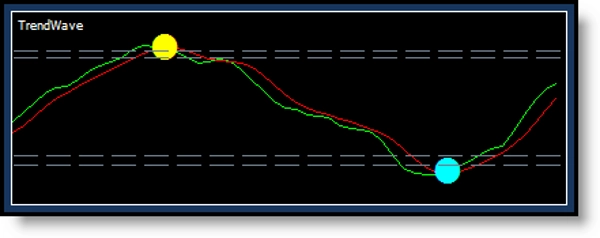
Es liefert Kauf- und Verkaufssignale, zeigt die Trendrichtung an und identifiziert überkaufte und überverkaufte Zonen. Visuell besteht es aus zwei Wertlinien mit einer Wolke/Histogramm in der Mitte, die sich über und unter einer Mittellinie bewegt und steigende oder fallende Trends darstellt.
Hauptmerkmale:
- Kaufsignale treten auf, wenn die grüne Linie die rote Linie nach oben kreuzt; Verkaufssignale, wenn die grüne Linie nach unten kreuzt.
- Es zeigt die Trendrichtung mit Wolkenwellen über oder unter der Mittellinie an.
- Der Indikator zeigt grüne (Kauf) und rote (Verkauf) Punkte an den Kreuzungspunkten, mit entsprechenden Kerzenfarbenänderungen (gelb für Kauf, türkis für Verkauf).
- Am besten auf 12-Stunden- oder 1-Tages-Intervallen verwenden, um übermäßiges kurzfristiges Rauschen zu vermeiden.
- Der Indikator kann Divergenzen zwischen Preis und Momentum erkennen (reguläre bullische und bärische Divergenz) und signalisiert potenzielle Preisumkehrungen.
- Es wird empfohlen, WaveTrend mit anderen Indikatoren wie WMA, CMF, RSI und MACD für zuverlässigere Handelsentscheidungen zu kombinieren.
Insgesamt ist WaveTrend ein funktionales Werkzeug, das nützlich ist, um die Trendrichtung und Handelssignale zu identifizieren, aber zusammen mit anderen Analysetools zur Bestätigung verwendet werden sollte.
Zusammenfassung
Indikatorprofil
Kundenbewertungen
5.0
Bewertungen: 2
5 | 100 % | |
4 | 0 % | |
3 | 0 % | |
2 | 0 % | |
1 | 0 % |
Kundenbewertungen
November 6, 2025
the main upside is the trade idea gets slowed down first. The setup still needs say no.
Diskussion
Häufig gestellte Fragen (FAQ)
Signal
ZigZag
EURUSD
Supertrend
GBPUSD
RSI
XAUUSD
NAS100
ATR
MACD
Über den cTrader Store verfügbare Produkte, einschließlich Handelsbots, Indikatoren und Plugins, werden von externen Entwicklern bereitgestellt und nur zu Informations- und technischen Zugriffszwecken verfügbar gemacht. cTrader Store ist kein Broker und erbringt keine Anlageberatung, persönlichen Empfehlungen oder eine Garantie für zukünftige Performance.


Preis
Seit 16/03/2025
256
Kostenlose Installationen