
Descrizione
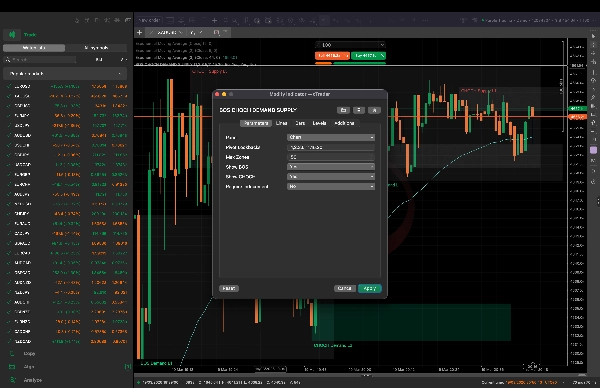
SMC BOS CHOCH PRO è un indicatore avanzato del Concetto di Smart Money (SMC) progettato per aiutare i trader a identificare con precisione i cambiamenti chiave nella struttura del mercato e le zone di trading istituzionali.
Questo indicatore rileva automaticamente Break of Structure (BOS) e Change of Character (CHOCH) per evidenziare la continuazione del trend e potenziali inversioni. Traccia dinamicamente zone di Offerta e Domanda basate su azioni di prezzo validate, permettendo ai trader di individuare aree di ingresso ad alta probabilità.
Utilizzando più periodi di lookback dei pivot, l'indicatore fornisce una vista multilivello della struttura di mercato, aiutando i trader ad allinearsi sia con i trend a breve termine che con quelli a timeframe più elevati su un unico grafico.
🔑 Caratteristiche principali
- Rilevamento automatico di BOS (continuazione del trend) e CHOCH (inversione del trend)
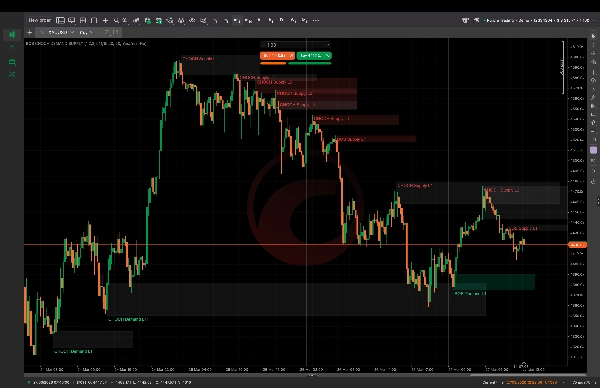
- Tracciamento in tempo reale di zone di Offerta e Domanda
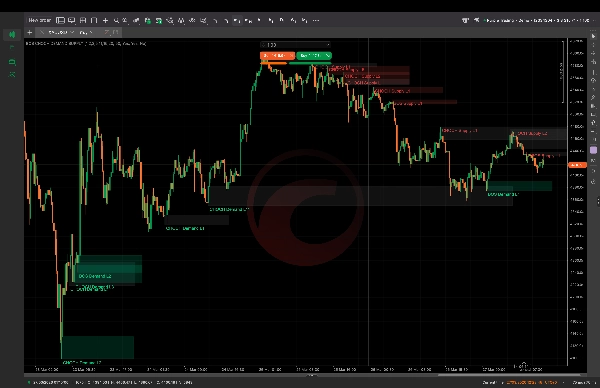
- Monitoraggio della mitigazione delle zone (le zone cambiano dopo il retest)
- Rimozione automatica di zone non valide/rotte
- Analisi della struttura multi-timeframe utilizzando più lookback dei pivot
- Visualizzazione del grafico pulita e intuitiva
- Filtraggio delle zone duplicate per una migliore chiarezza
📊 Come funziona
- Identifica massimi e minimi swing utilizzando la logica dei pivot
- Rileva rotture di struttura quando il prezzo chiude sopra/sotto livelli chiave
- Classifica i movimenti come BOS o CHOCH basandosi sulla struttura precedente
- Disegna le zone dall'ultima candela opposta prima del movimento
- Aggiorna dinamicamente le zone mentre il prezzo interagisce con esse
🎯 Migliori casi d'uso
- Trading intraday (Forex, Oro, Indici)
- Scalping con conferma della struttura
- Trading di continuazione e inversione del trend
- Strategie Smart Money / Price Action
👤 A chi è rivolto
- Trader che utilizzano strategie SMC o Price Action
- Principianti che vogliono comprendere la struttura del mercato
- Trader avanzati alla ricerca di una mappatura automatizzata della struttura
Riepilogo
Key features include automatic detection of BOS and CHOCH, real-time plotting and dynamic updating of Supply & Demand zones, zone mitigation tracking after retests, removal of invalid or broken zones, and multi-timeframe structure analysis using multiple pivot lookbacks. It provides a clean, intuitive chart visualization with duplicate zone filtering for clarity.
The indicator works by identifying swing highs and lows through pivot logic, detecting structure breaks when price closes beyond key levels, classifying moves as BOS or CHOCH, and drawing zones from the last opposing candle before the move. Zones update dynamically as price interacts with them.
It is suitable for intraday trading in markets such as Forex, Gold (XAUUSD), and Indices, supporting strategies like scalping, trend continuation, reversal trading, and Smart Money/Price Action approaches. The tool is designed for traders using SMC or Price Action strategies, including beginners and advanced users seeking automated market structure mapping.
Recensioni dei clienti
5 | 0 % | |
4 | 100 % | |
3 | 0 % | |
2 | 0 % | |
1 | 0 % |


![Logo di "[Stellar Strategies] Smart ADX"](https://cdn.ctrader.com/image/webp/af13b084-b6f6-41db-b7bc-c7e688b57b05_36929)