MACD Custom Indicator - Multiple Time Frame
Indikator
Version 1.0, May 2026
Windows, Mac
4.0
Bewertungen: 2
Trading product for MACD Custom Indicator - Multiple Time Frame Indikator EMA Volume, image 2
Trading product for MACD Custom Indicator - Multiple Time Frame Indikator EMA Volume, image 3
Trading product for MACD Custom Indicator - Multiple Time Frame Indikator EMA Volume, image 4
Trading product for MACD Custom Indicator - Multiple Time Frame Indikator EMA Volume, image 5
46
Verkäufe
3.93K
Kostenlose Installationen

Beschreibung

🔥 **PrimeQuant CM Ultimate MACD MTF v1.0** 🔥


**Das perfekte TradingView-zu-cTrader MACD Upgrade**

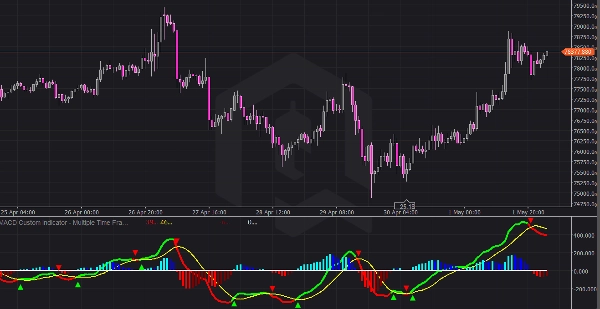
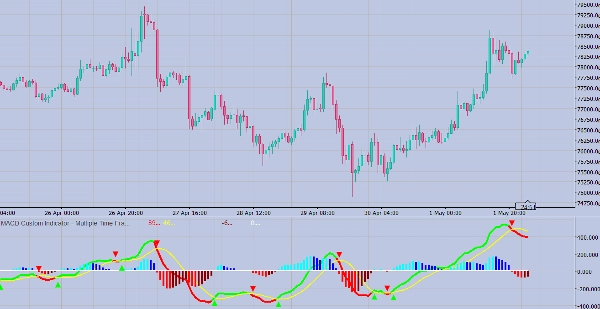
✅ Exakte visuelle Nachbildung des berühmten CM MACD Ultimate MTF Pine Script

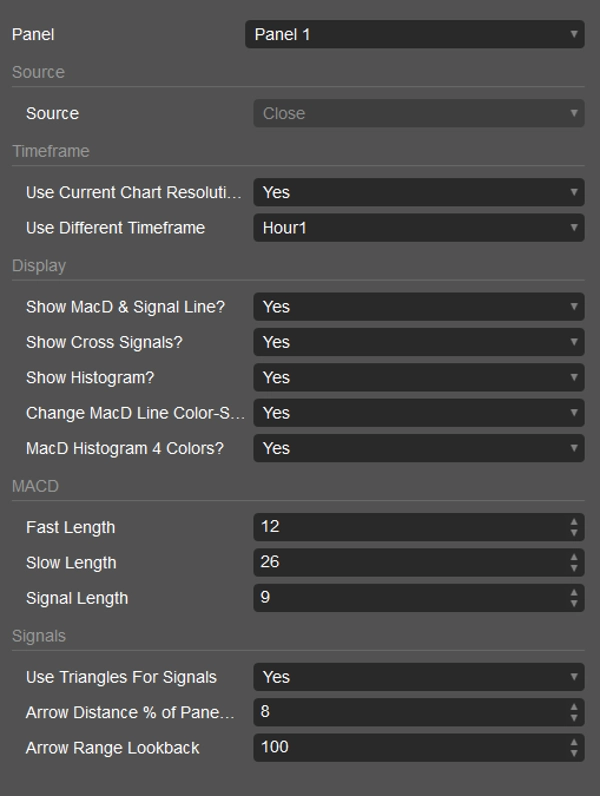
✅ Multi-Timeframe-Unterstützung (aktuelles Chart oder benutzerdefiniertes HTF)

✅ Kontinuierliche MACD-Linie mit dynamischer grüner/roter Trendfärbung

✅ Gelbe Signallinie

✅ 4-Farben-Histogramm (Übergänge über/unter Null)

✅ Dreieck-Kreuzsignale (Auf-/Ab-Pfeile mit perfektem Abstand)

✅ Null-Referenzlinie


**🎯 Hauptmerkmale:**

- **📊 MTF Flexibilität**: Verwenden Sie den aktuellen Zeitrahmen oder wählen Sie benutzerdefinierten HTF (1m-1M)

- **🎨 Intelligente Farbgebung**: MACD-Linie wechselt bei Signal-Kreuz grün/rot

- **📈 4-Farben-Histogramm**: Aqua/Blau über Null, Rot/Maroon darunter

- **🔺🔻 Dreieckssignale**: Saubere Auf-/Ab-Pfeile an Kreuzungspunkten

- **⚙️ Volle Anpassung**: Schalten Sie jedes Element unabhängig ein oder aus


**🚀 So verwenden Sie es:**

1. **Zum Chart hinzufügen** → Erscheint in einem separaten Panel

2. **Aktueller TF** → "Aktuelle Chartauflösung verwenden" aktivieren (Standard)

3. **Höherer TF** → Deaktivieren + Zeitrahmen auswählen (z.B. H1 auf M5-Chart)

4. **Signale** → "Kreuzsignale anzeigen" für Dreieckmarker aktivieren

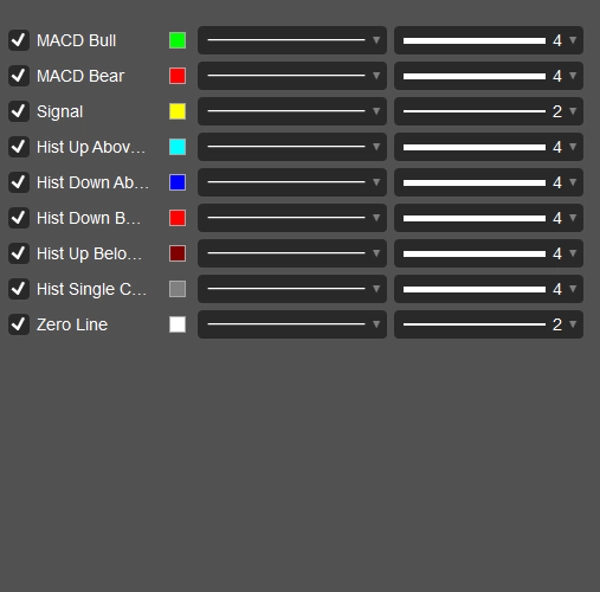
5. **Anpassen** → Farben, Abstände, Histogramm-Stile einstellen


**📈 Handelssignale:**

- 🔺 **Grünes Aufwärts-Dreieck** = MACD kreuzt ÜBER das Signal (bullisch)

- 🔻 **Rotes Abwärts-Dreieck** = MACD kreuzt UNTER das Signal (bärisch)

- **Grüner MACD** = Über dem Signal (bullische Tendenz)

- **Roter MACD** = Unter dem Signal (bärische Tendenz)

- **Histogramm-Divergenz** = Achten Sie auf Momentum-Wechsel


**💎 PrimeQuant Qualität**

Entwickelt für cTrader 5.6.10+ | Keine Fehler | Native Leistung | Professionelle Optik


**⭐ Perfekt für:** Scalper, Swing-Trader, HTF-Analyse auf niedrigeren Charts

Zusammenfassung

KI-Zusammenfassung
The MACD Custom Indicator - Multiple Time Frame is a momentum indicator designed for the cTrader platform, replicating the visual style of the CM MACD Ultimate MTF Pine Script from TradingView. It supports multi-timeframe analysis, allowing users to apply the MACD calculation on the current chart timeframe or select a custom higher timeframe ranging from 1 minute to 1 month. The indicator features a continuous MACD line that dynamically changes color (green/red) based on trend direction, a yellow signal line, and a four-color histogram that visually distinguishes momentum shifts above and below zero. Triangle-shaped cross signals mark bullish and bearish MACD-signal line crossovers with up and down arrows, respectively. A zero reference line is also included for trend context. Users can fully customize the display elements independently, including colors, distances, and histogram styles. The indicator appears in a separate panel on the chart and is suitable for scalpers, swing traders, and higher timeframe analysis on lower timeframe charts. It provides visual signals for trend strength, crossovers, and potential momentum divergences to assist in trading decisions.
Indikatorprofil
Indikatorkategorie
Momentum
Ausgabetyp
Visualisierung
Signale
Datenanforderungen
Nur Balken
Unterstützte Signale
Durchbrechen
Abweichung
Wendepunkt
Trendstärke

Kundenbewertungen

4.0
Bewertungen: 2
5
0 %
4
100 %
3
0 %
2
0 %
1
0 %
Kundenbewertungen
May 17, 2026
messy signals are easier to question, but it should not replace the chart.
May 16, 2026
Demo first, then maybe small size if the notes look sane, and forcing the entry still creates problems.

Diskussion

Häufig gestellte Fragen (FAQ)

EMA
Volume
MACD
Triangle
Moving Average
VWAP
Support & Resistance
Über den cTrader Store verfügbare Produkte, einschließlich Handelsbots, Indikatoren und Plugins, werden von externen Entwicklern bereitgestellt und nur zu Informations- und technischen Zugriffszwecken verfügbar gemacht. cTrader Store ist kein Broker und erbringt keine Anlageberatung, persönlichen Empfehlungen oder eine Garantie für zukünftige Performance.

Mehr von diesem Autor

Indikator
ATR
SMC
+19
Free Smart Money Concepts from TradingView for cTrader: BOS/CHoCH, OB, FVG, liquidity, MTF levels, discount zones.
Indikator
ATR
SMC
+18
Precision SMC tool with HTF sweeps, MSS confirmation & smart FVG detection for high-probability reversals.
Indikator
ATR
Prop
+16
Get the exact SuperTrend experience from TV, now perfectly rebuilt for cTrader
Indikator
Prop
ZigZag
+5
All-in-One ICT/SMC Institutional Framework — Ranges, Structure, Liquidity, Fibonacci & Time Engine.
Indikator
RSI
MACD
+5
WaveTrend Oscillator with signal line, spread histogram and OB/OS levels for precise momentum trading.
Indikator
ATR
SMC
+19
Smart Liquidity Sweep detector with auto-drawing True Channels and real market structure mapping.
Indikator
Forex
BTCUSD
+11
📈 Adaptive ALMA-Gaussian hybrid trend filter with precision smoothing and clear buy/sell signals.
Indikator
SMC
Forex
+15
Smart institutional order block & FVG scanner with alerts, zone merging, and HTF confluence.
cBot
SMC
Forex
+11
💎 ICT Silver Bullet Strategy cBot — liquidity sweep & breakout algorithm with risk control.
Indikator
Forex
Crypto
+5
🚀 Automated Elliott Wave & Fibonacci tool for cTrader. Spot trends, corrections & retracements fast.
Indikator
ADX
ATR
+5
Precision Sniper by PrimeQuant: Advanced confluence engine with auto-presets, dynamic TP/SL, and live backtest stats.
Indikator
ATR
SMC
+17
Adaptive Swing-Anchored VWAP that tracks market structure shifts with precision and clarity.

Das könnte Sie auch noch interessieren

Indikator
RSI
Forex
+10
Unlock Stochastic RSI PRO in cTrader! Overlay RSI, highlight zones, and identify divergences with customizable settings.
Indikator
Prop
Forex
+11
Market Structure Shift – Professional Market Structure Oscillator
Indikator
A compact, visual multi-timeframe trend indicator for cTrader. Easily spot bullish or bearish trends across 4 customizab
Indikator
Key Levels
Market Structure
+1
Sessions, ICT killzones, multi-ORB and previous levels. One clean, no-repaint cTrader overlay.
Indikator
MSS
Key Levels
+2
Maps equal highs, equal lows and active liquidity pools directly on your cTrader chart.
Indikator
AI
Prop
+7
EMA Clouds, Multi-Timeframe (MTF) Overlay, Swing High/Low detection, and a smart Dashboard with neutral zone filtering.
Indikator
AI
SMC
+13
Dynamic Liquidity Depth exposes hidden volume
Indikator
ATR
Market Structure
Adaptive multi timeframe market condition analyzer that identifies the most tradeable timeframe.
Indikator
Signal
Cumulative Volume Delta tracks the net difference in tick volume between buying and selling pressure over time
Indikator
RSI
Forex
+6
🚀 QQEX Trinity Indicator - The Ultimate Trading Filter 🚀
Indikator
Prop
Forex
+13
Supertrend - Multi-Timeframe Indicator
Indikator
The Break of Structure (BoSCHoCh) Indicator is a smart market structure tool designed to help traders easily spot trend.
Indikator
AI
Grid
+9
Pivot Point MultiTimeFrame with Order Block
Indikator
Order Block
Fair Value Gap
+2
This indicator contains most of the ICT strategies that you need. You can turn on/off each one to be shown.
Indikator
RSI
Forex
+4
😎Read the description before purchasing💩
Indikator
Volume
Key Levels
+4
Session & Kill Zone Highlighter - Visual tool for London, NY, Tokyo, Sydney sessions plus ICT Kill Zones.
Indikator
Candle Timer & Strength Panel for cTrader Description: Candle Timer & Strength Panel is an advanced, always-visible over
Indikator
ATR
Engulfing
+5
This indicator maps D1, H4, H1 and 15M Multi-Timeframe Bias and Fresh High Probability Supply and Demand zones

Preis

46
Verkäufe
3.93K
Kostenlose Installationen