
Описание
Описание
Индикаторы Pinescriptlabs Store: 🤖Pinescriptlabs Store cBots :
ICT Power of 3 (cBot) Gold & BTC BreakoutSession Pivots(новый)YieldShield"
SmartTrend Support &
Resistance Lines
Dynamic Market Structure
Анализ поворотных точек
Fibonacci Linear
Регрессия на нескольких таймфреймах
Multi-Level Candle Bias
Tracker
Auto Support and
Resistance Trend Lines
All Support and
Resistance Levels
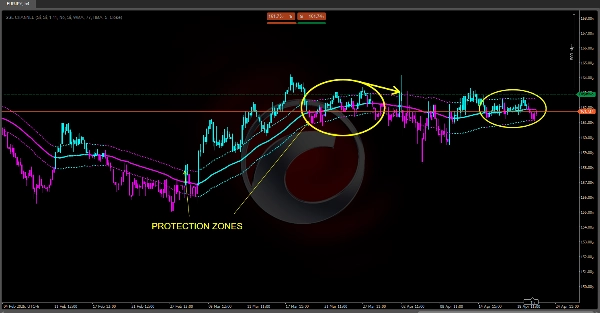
Премиальный SSL канал 🔍
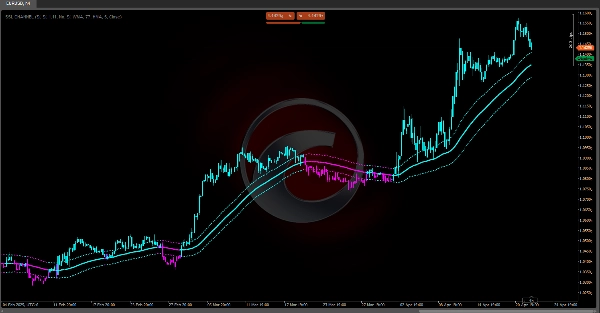
Объединяет обнаружение тренда через скользящую среднюю, оценку волатильности с помощью полос на основе ATR и краткосрочный фильтр (SSL) для создания интегрированной системы анализа. 💡 Его сила заключается в ясности визуальных сигналов и адаптивности на разных рынках, в то время как главная задача — минимизировать запаздывание и фильтровать боковые движения. При правильной параметризации он становится мощным инструментом для принятия решений о входе/выходе в торговле. 🎯
1. Назначение и торговая полезность 📊
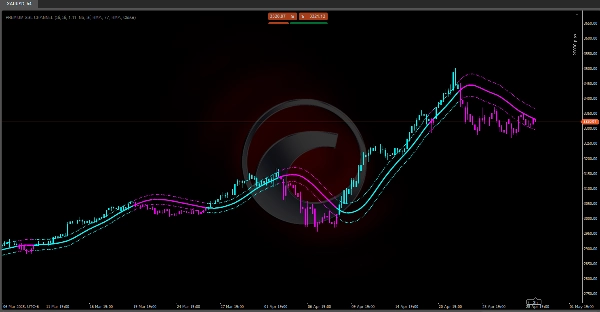
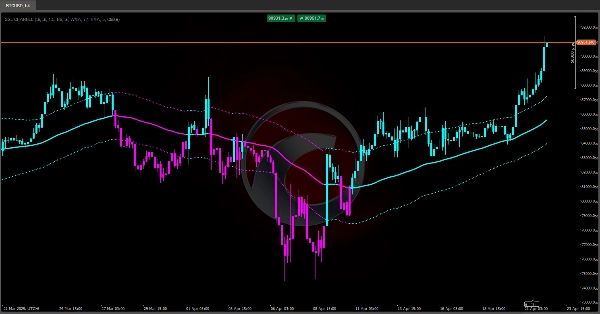
• Основное обнаружение тренда: Благодаря центральной линии (\"Базовая линия\"), индикатор показывает доминирующее направление рынка. 📈📉
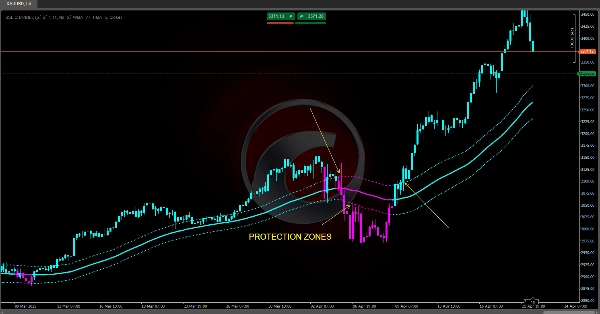
• Измерение волатильности: Используя средний диапазон (ATR), он регулирует две полосы (выше/ниже базовой линии) как динамические зоны поддержки/сопротивления. ⚡
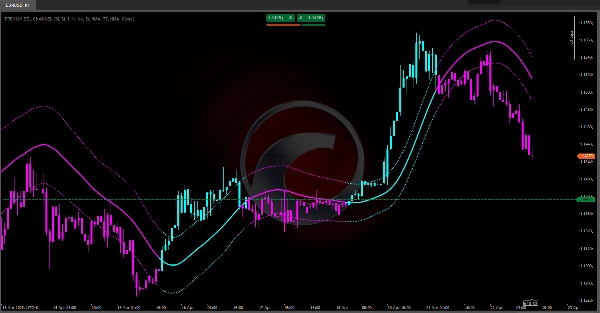
• Фильтр шума и сдвиг смещения: Канал SSL (адаптивная скользящая средняя на основе максимумов/минимумов) выявляет краткосрочные развороты для точных входов/выходов. 🔄
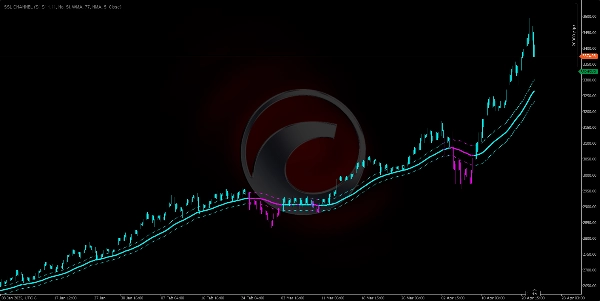
• Интуитивная визуализация: Окрашивает бары цены и линии по смещению (голубой = бычий, пурпурный = медвежий) для мгновенной интерпретации. 🎨
2. Основные компоненты и логика ⚙️
2.1. Центральная линия (\"Базовая линия\")
• Вычисляет скользящую среднюю цены (SMA, EMA, WMA или Hull) для сглаживания шума.
• Представляет среднее значение рынка, показывая доминирующий тренд:
- Цена выше → Бычий тренд. 🟢
- Цена ниже → Медвежий тренд. 🔴
2.2. Средний диапазон (ATR)
• Измеряет реальную волатильность рынка, усредняя предыдущие максимумы/минимумы/закрытия.
• Высокий ATR = Больше волатильности; Низкий ATR = Более спокойные рынки. 🌊
2.3. Динамические полосы (\"Верхний ATR\" и \"Нижний ATR\")
• Верхний ATR = Базовая линия + (ATR × Множитель)
• Нижний ATR = Базовая линия – (ATR × Множитель)
• Выступают в роли ценовых каналов:
- Цена касается верхней полосы → Бычья сила. 🚀
- Цена близка к нижней полосе → Медвежий импульс. 🐻
2.4. Канал SSL (Signal-Smooth-Line)
• Использует скользящие средние по максимумам и минимумам отдельно.
• Логика направления:
- Закрытие выше высокой MA → Бычий уклон. ✅
- Закрытие ниже низкой MA → Медвежий уклон. ❌
- Посередине → Предыдущий уклон сохраняется.
• Выступает в роли краткосрочного фильтра тренда, подтверждающего/противоречащего базовой линии. 🔄
3. Генерация сигналов и практическое использование 🛠️
1. Подтверждение тренда
- Сильный бычий: Цена > Верхний ATR. 🟢
- Умеренный бычий: Верхний ATR > Цена > Базовая линия.
- Умеренный медвежий: Базовая линия > Цена > Нижний ATR.
- Сильный медвежий: Цена < Нижний ATR. 🔴
2. Фильтр SSL
- Входы: Входить в лонг только если SSL выше своей линии (или шорт, если ниже). ⬆⬇
- Выходы: Частичный/полный выход при развороте SSL и пересечении противоположной высокой/низкой MA. ✋
3. Окраска баров
- Бары цены окрашиваются в голубой (бычий) или пурпурный (медвежий), синхронизированно с базовой линией для быстрого чтения рынка. 🎨
4. Настраиваемые параметры и их влияние ⚖️
• Период базовой линии: Длиннее = плавнее, но с запаздыванием; короче = отзывчивее, но шумнее. 🐢⚡
• Множитель полос: Выше = шире канал (меньше ложных сигналов); ниже = уже (больше сигналов, больше ложных срабатываний). ↔️
• Тип MA (SMA/EMA/WMA/HMA): Влияет на взвешивание последних и исторических цен. 📅
• Период и тип SSL: Определяет чувствительность краткосрочного фильтра. 🎚️
Сводка
Отзывы покупателей
5 | 100 % | |
4 | 0 % | |
3 | 0 % | |
2 | 0 % | |
1 | 0 % |


