Description
🔷 Trend Lines Premium Engine
Multi-Layer Market Structure & Dynamic Regression Indicator
https://chartshots.spotware.com/c/69d3c949a2e08
📌 What is it?
Trend Lines Premium Engine is an overlay indicator that combines 5 independent modules into a single tool. Each module can be toggled on or off. It maps market structure, dynamic channels, and volume-based regression zones directly on the price chart.
It answers three core questions:
- Where is price within the current structure?
- What is the dominant trend and where are the breaking points?
- At which price levels is activity concentrated?
🧩 The 5 Modules
1️⃣ Swing Range Connector
https://chartshots.spotware.com/c/69d3cab9b805b
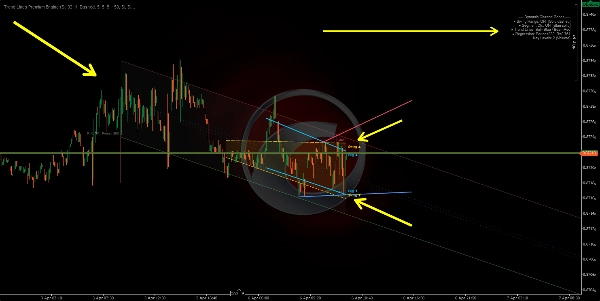
Detects the most recent swing highs and swing lows, then draws a sloped channel connecting the oldest to the newest on both sides. The area between is filled as a dynamic range zone.
How it works:
- A bar qualifies as a swing point when its high (or low) is the most extreme compared to N bars before and N bars after it.
- A straight line is drawn from the oldest stored swing to the most recent, creating upper and lower boundaries.
- The channel shifts automatically each time a new swing point is confirmed.
How to read it:
- Price inside the channel → defined structural range.
- Break above/below → volatility expansion or structure shift.
- Channel slope → predominant range direction.
Parameter
Purpose
Bars Before / After Swing
Bars required on each side to confirm a swing. Higher = more significant swings
Max Swing Points
How many swings to store. Controls channel depth
History Window
How far back the channel is drawn
2️⃣ Segment Linear Channel
https://chartshots.spotware.com/c/69d3cb221bba1
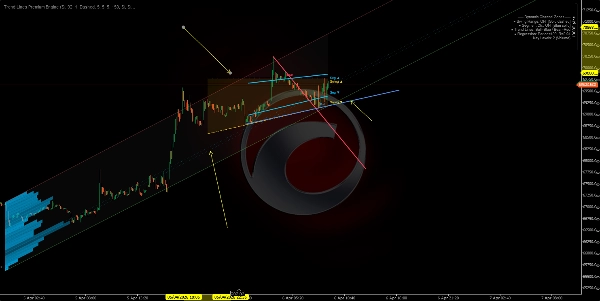
Splits the analysis window into 5 equal segments, finds the highest high and lowest low in each, then fits a least-squares regression line through those 5 upper points and another through the 5 lower points.
How it works:
- The window is divided into 5 parts. One representative extreme is extracted per part.
- Linear regression is applied over those 5 points for each boundary.
- The result is a channel that adapts to segmented price structure rather than just two endpoints.
How to read it:
- Ascending channel → structural uptrend.
- Descending channel → structural downtrend.
- Repeated touches on a boundary → dynamic support/resistance.
Difference from Module 1: Swing Range connects only the first and last swing. Segment Channel uses 5-point regression, making it smoother and less reactive to a single swing.
3️⃣ Swing Point Labels
Detects swing highs and lows and classifies them into 4 market structure categories:
Label
Meaning
Indicates
HL
Higher Low
Bullish structure
HH
Higher High
Bullish structure
LH
Lower High
Bearish structure
LL
Lower Low
Bearish structure
How it works:
- Each new swing low is compared to the previous swing low. Higher → HL. Lower → LL.
- Each new swing high is compared to the previous swing high. Higher → HH. Lower → LH.
How to read it:
- HL + HH sequence → uptrend intact.
- LH + LL sequence → downtrend intact.
- An HL breaking into LL, or an LH breaking into HH → structure shift (BOS/CHoCH).
By default only HL and LH are displayed to keep the chart clean. HH and LL can be enabled for full structure visibility.
4️⃣ Automatic Trend Lines
https://chartshots.spotware.com/c/69d3cc071272e
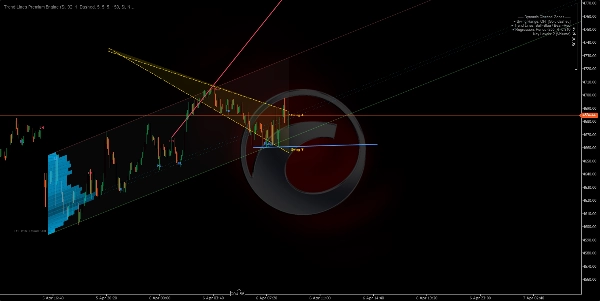
Draws trend lines connecting the two most recent swing lows (bullish line) and the two most recent swing highs (bearish line). The active line is prominent; previous lines fade out.
How it works:
- New swing low detected → line drawn from prior swing low to the new one (bullish trend line).
- New swing high detected → line drawn from prior swing high to the new one (bearish trend line).
- The line projects forward by a configurable number of bars.
- When a new line is created, the previous one fades to a semi-transparent color.
Breakout signals (optional): When enabled, the indicator detects if the closing price crosses an active trend line:
- 🔼 Up arrow → bullish breakout.
- 🔽 Down arrow → bearish breakout.
Parameter
Purpose
Max Line Pairs
How many line pairs to keep visible. Set to 1 for cleanest view
Max Extension Bars
How far the line projects forward. Prevents lines from crossing the entire chart
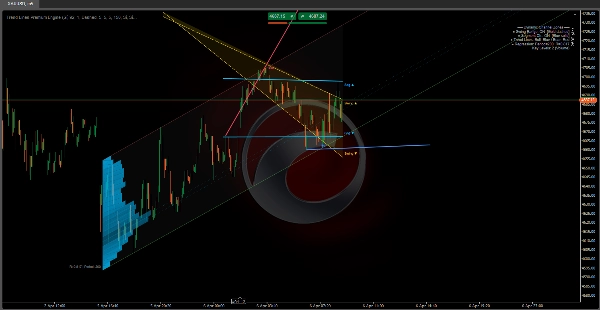
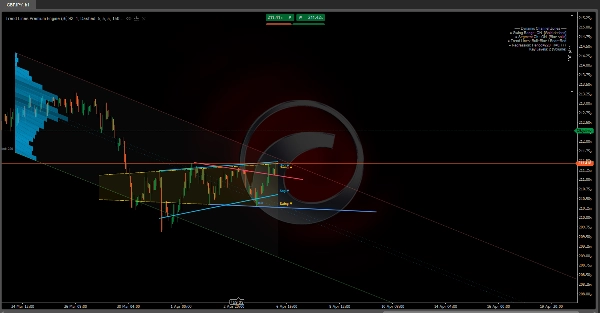
5️⃣ Dynamic Regression Zone
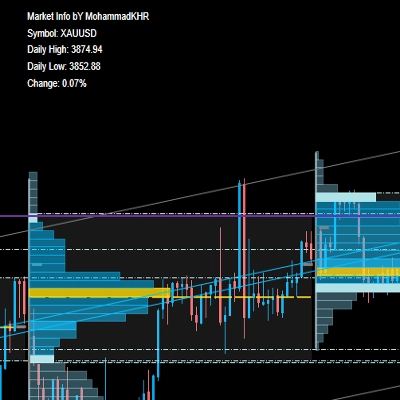
The most advanced module. Calculates a linear regression channel on closing prices and overlays an activity profile (histogram) showing where volume or touches concentrated within the channel. It also marks key levels at the highest-activity zones.
A) Regression Channel:
- Least-squares linear regression is applied to closing prices over a given period.
- Standard deviation of prices from the regression line is calculated.
- Upper and lower bands are placed at N standard deviations from the center (default: 2.0).
- Optionally computed in logarithmic scale for better accuracy on high-price or high-volatility instruments.
B) Auto Period Detection:
- The algorithm tests multiple periods (50 to 400 bars) and calculates the Pearson correlation coefficient for each.
- It selects the period with the highest correlation — where the linear regression best fits the price movement.
- The correlation value is displayed on the chart (e.g., R = 0.85).
C) Activity Histogram:
- The channel is divided into horizontal sections (up to 25).
- For each section, the algorithm counts how many bars touched that price level, weighted by volume or number of touches (configurable).
- Higher-activity sections appear as longer, more opaque bars.
- This reveals the Point of Control (POC) and high/low activity zones within the channel.
D) Key Levels:
- The sections with the highest activity are projected forward as horizontal lines.
- They function as volume-based support and resistance within the regression context.
How to read it:
- Price near upper band → statistically overbought zone.
- Price near lower band → statistically oversold zone.
- R close to 1 or -1 → strong, reliable linear trend. R close to 0 → ranging or regression is not significant.
- Key levels act as price magnets — zones with historical activity concentration tend to attract price back.
🎯 Use Cases
Use Case
Modules
Identify market structure (bullish/bearish/range)
Swing Labels + Trend Lines
Detect dynamic support & resistance
Swing Range + Segment Channel
Find value zones by volume
Regression Zone + Key Levels
Confirm structure breaks
Trend Lines + Breakout Signals
Measure trend strength
Pearson Correlation (Regression Zone)
⚙️ Recommended Setup by Style
Style
Suggested Modules
Scalping (M1–M15)
Swing Labels + Trend Lines
Intraday (M15–H1)
All modules
Swing Trading (H4–D1)
Swing Range + Regression Zone + Key Levels
Pure structure analysis
Swing Labels + Trend Lines only
⚠️ Important Notes
Summary
The five modules include:
1. Swing Range Connector: Detects recent swing highs and lows to draw a sloped channel representing the structural range.
2. Segment Linear Channel: Divides the analysis window into five segments, fitting regression lines through highs and lows for a smoother channel.
3. Swing Point Labels: Classifies swing highs and lows into four market structure categories (Higher High, Higher Low, Lower High, Lower Low) to indicate bullish or bearish trends and structure shifts.
4. Automatic Trend Lines: Connects the two most recent swing highs and lows with trend lines, highlighting active lines and optionally signaling breakouts.
5. Dynamic Regression Zone: Calculates a linear regression channel on closing prices with an activity histogram showing volume or touch concentration, marking key volume-based support and resistance levels.
The indicator supports various trading styles, recommending specific module combinations for scalping, intraday, swing trading, and pure structure analysis. It requires price bars and volume data and provides visualizations and signals including breakout, trend strength, and level touches or breaks.