Beschreibung
Hammer Pattern Indikator – Strategieerklärung
Dieser Hammer Pattern Indikator ist ein kerzenbasierendes Umkehrsignal, das bullische Hammer-Muster in einem Abwärtstrend erkennt. Er ist darauf ausgelegt, potenzielle Trendwenden zu erkennen und Kaufgelegenheiten hervorzuheben.
Funktionsweise
1️⃣ Erkennt Abwärtstrend
- Der Schlusskurs der Kerze muss niedriger sein als der Schlusskurs vor 3 Balken, was auf einen möglichen Abwärtstrend hinweist.
2️⃣ Validiert die Hammer-Kerzenstruktur
- Kleiner Körper: Der Körper der Kerze ist relativ klein (≤ 30 % der Gesamtrange).
- Langer unterer Schatten: Der untere Docht ist mindestens doppelt so lang wie der Körper (zeigt starke Ablehnung niedrigerer Preise).
- Kurzer oberer Schatten: Der obere Docht ist ≤ 30 % der Körpergröße (zeigt wenig Widerstand oben an).
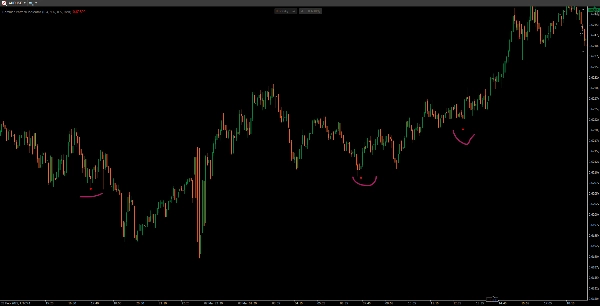
3️⃣ Zeichnet ein Kaufsignal
- Wenn alle Bedingungen erfüllt sind, erscheint ein roter Punkt (oder eine gewählte Farbe) leicht unter dem Tief der Hammerkerze als visuelle Bestätigung einer möglichen Umkehr.
Hauptmerkmale
✅ Filtert schwache Signale, indem ein vorheriger Abwärtstrend sichergestellt wird.
✅ Anpassbare Parameter für Körpergröße, Schattenlänge und Farben.
✅ Einfaches, aber effektives Kerzenmuster für Swing-Trader und Price-Action-Trader.
📌 Beste Verwendung: Bestätigen Sie das Hammer-Muster mit zusätzlichen Indikatoren (z. B. Volumen, Unterstützungsniveaus) für stärkere Signale! 🚀
Zusammenfassung
Kundenbewertungen
5 | 100 % | |
4 | 0 % | |
3 | 0 % | |
2 | 0 % | |
1 | 0 % |