
Zero Lag Exponential Moving Average
インジケーター
258 ダウンロード数
バージョン 1.0、Aug 2025
Windows、Mac
説明
ZLEMA(Zero Lag Exponential Moving Average)は、従来の指数移動平均(EMA)に伴う遅延を減らすために設計された指数移動平均(EMA)の高度なバージョンです。特殊な計算方法を使用することで、ZLEMAは価格変動により迅速に反応し、特に変動の激しい市場で効果的です。
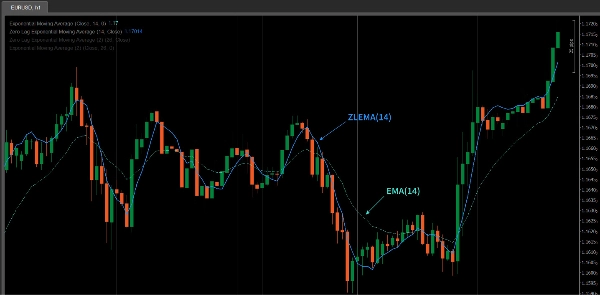
ZLEMAの主な特徴は「ゼロラグ」特性であり、特に動きの速い市場環境で価格の動きをより正確に追跡できます。従来のEMAと比較して、ZLEMAは応答速度が速く、市場のトレンドをよりタイムリーに捉えます。
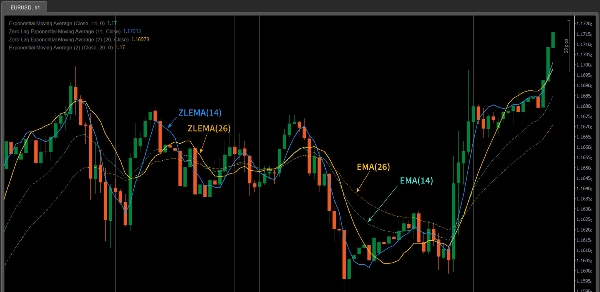
ZLEMAとEMAの比較
- 応答速度:ZLEMAは従来のEMAよりも速く反応します。遅延を補正することで、価格変動により迅速に追従します。
- 平滑効果:ZLEMAはEMAと同様の平滑効果を維持しつつ、価格の遅延を最小限に抑え、動きの速い市場に適しています。
- 使用例:非常に変動の激しい市場(短期取引や日中取引など)で取引する場合、ZLEMAは応答性の面でEMAを上回ることがあります。
ZLEMAインジケーターの特徴
- ゼロラグ応答:ZLEMAは遅延を減らし、市場価格の変動に迅速に反応できるため、急速な市場変化をより正確に捉えられます。
- 滑らかさ:より速い応答性を提供しながらも、ZLEMAはEMAの平滑効果を保持し、価格変動によるノイズを回避します。
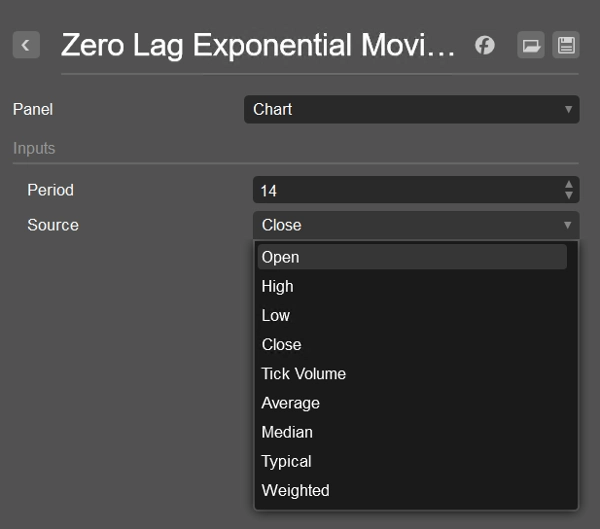
- 柔軟性:ZLEMAは
Close、Open、Highなど、さまざまな価格データソースで使用でき、トレーダーは戦略のニーズに応じて調整できます。 - トレンド追従および反転シグナルの確認:ZLEMAは特に変動の激しい市場でトレンドの変化を特定し、価格反転シグナルの確認に適しています。
ZLEMAインジケーターの使い方
- 短期トレーダー:ZLEMAは価格変動に素早く反応できるため、短期トレーダーに最適です。短期のトレンド反転やブレイクアウトシグナルを捉えるのに適しています。
- トレンド追従:ZLEMAは長期トレンドの追跡にも使用できますが、EMAよりも感度が高いです。強いトレンドでは、トレンドの開始や終了をより迅速に特定し、戦略のタイムリーな調整を支援します。
- 他のインジケーターとの組み合わせ:ZLEMAはRSI、MACD、価格パターン分析などの他のテクニカルインジケーターと組み合わせることでシグナルの精度を高めます。特に移動平均などのトレンド追従インジケーターと組み合わせて、価格のブレイクアウトや反転を確認するのに有用です。
- ブレイクアウトと反転の確認:ZLEMAは重要なレベルからの価格のブレイクアウトや反転シグナルの確認に役立ちます。例えば、価格がZLEMAラインを越えるとトレンドの変化を示す可能性があります。
- ノイズの低減:遅延が減少しているため、ZLEMAは従来の移動平均に存在する可能性のあるノイズをより効果的にフィルタリングし、日中取引や非常に変動の激しい市場で重要なツールとなります。
ZLEMA使用のヒント
- 期間の調整:取引スタイルや市場の変動性に応じてZLEMAの期間を調整してください。短期取引には短い期間(例:10または14)、長期トレンド追跡には長い期間(例:50または100)が適しています。
- 他のツールとの組み合わせ:ZLEMAは優れたトレンド追従能力を提供しますが、RSIによる買われすぎ/売られすぎの状態やMACDによるトレンドの強さなど、他のインジケーターと組み合わせることで精度が向上します。
- テストと最適化:ZLEMAのパフォーマンスは市場状況によって異なる場合があります。ライブ取引で使用する前に、バックテストと最適化を十分に行い、戦略で最良の結果を得られるようにすることをお勧めします。
概要
AIによる概要
The Zero Lag Exponential Moving Average (ZLEMA) is an advanced technical indicator designed to improve upon the traditional Exponential Moving Average (EMA) by reducing lag. It achieves faster response times to price changes while maintaining the smoothing effect of EMA, making it suitable for capturing quick market shifts and trends, especially in volatile or fast-moving markets.
Key features include:
- Zero lag response for timely reaction to price fluctuations.
- Smoothness that filters out noise without sacrificing responsiveness.
- Flexibility to use various price data inputs such as Close, Open, or High prices.
- Utility in trend following and confirming reversal signals.
ZLEMA is particularly useful for short-term traders seeking to capture rapid trend reversals or breakouts, as well as for longer-term trend tracking with enhanced sensitivity compared to EMA. It can be combined with other indicators like RSI or MACD to improve signal accuracy and confirm price breakouts or reversals.
Users can adjust the indicator’s period to match their trading style and market conditions, optimizing performance through backtesting. ZLEMA helps reduce noise and lag, making it a valuable tool for intraday and volatile market trading.
インジケーターのプロフィール
カスタマーレビュー
0.0
レビュー: 0
カスタマーレビュー
この商品にはまだレビューがありません。お使いになったことがある方は、ぜひレビューをお願いします。
ディスカッション
よくあるご質問
cTrader Storeで入手可能な取引ボット、インジケーター、プラグインなどの商品は、第三者の開発者が提供するものであり、情報と技術の取得のみを目的としてご利用いただけます。cTrader Storeはブローカーではなく、投資助言や個人的な推奨を行うことも、将来のパフォーマンスを保証することもありません。
これも好きかも


価格
登録日 14/07/2025
258
無料インストール