
Description
🚀 10,000+ traders already use our TOP indicators🏆
👉 Get all our TOP systems here:
_______________________________________________
📌 Market Structure Indicators
· ✅ AdvancedMarket Structure: Bos, Choch, SwinLevels, Order Blocks, Market Structure& Liquidity Finder
· 🔄 Dynamic Market StructureAnalysis of Turning Points
· 🧱 Order Block
· ⚖️ Market Imbalance
· ⛓️ BOS & CHOCH
· 🧠 ICT Power of 3
_______________________________________________
🔚 Smart Exit Systems
_______________________________________________
📐 ZigZag Indicators
· 🔍 ZigZag Price LiquidityProjection
· ➖ ZigZag
_______________________________________________
🧱 Support & Resistance Indicators
· 🟩 SmartTrend Support &Resistance Lines
· 🧱 All Support and ResistanceLevels
_______________________________________________
📊 Trend & Channel Indicators
· 📊 Supertrend
_______________________________________________
💧 Volume & Liquidity Tools
_______________________________________________
⚡ Momentum & RSI Indicators
· 🔎 Multi-Level Candle Bias
Tracker
_______________________________________________
🔮 Prediction & Projection Tools
· 📐 Prediction Based on Linreg& ATR
· 📏 Fibonacci Linear RegressionMulti-timeframe
· 📈 Volume-Powered Market Flow Projector
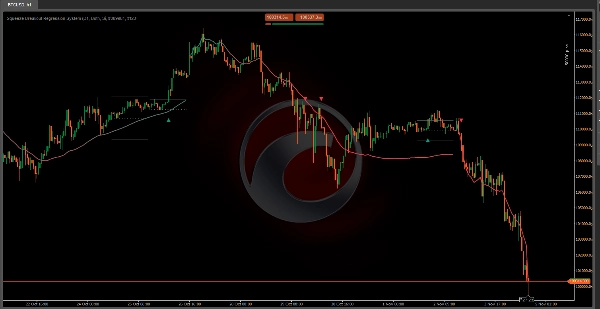
📊 Squeeze Breakout Regression System -🚀
🎯 What is it and what is it for? ❓
This indicator combines two complementary systems to identify high-probability trading opportunities:
- Squeeze System (Volatility Compression): 🔍 Detects moments when the market is "compressed" and about to explode in any direction 💥
- Trend Channel System (Linear Regression): 📈 Shows the dominant trend and its dynamic support/resistance limits
🔍 How does it work? ⚙️
PART 1: Squeeze Detection
The indicator analyzes a higher timeframe (default: Daily) and looks for candles whose range (difference between high and low) is the smallest in:
• 7 periods = "Short Squeeze" (short compression)
• 10 periods = "Extended Squeeze" (extended compression - stronger) 💪
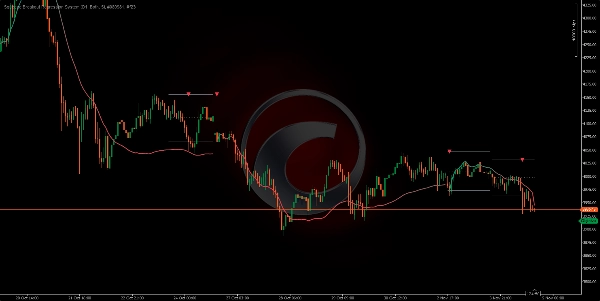
What happens when it detects a Squeeze?
- It draws three horizontal lines:
o Upper line = Resistance (level to break to the upside) ↗️
o Lower line = Support (level to break to the downside) ↘️
o Central dotted line = Pivot (midpoint) ⚖️ - It waits for the breakout:
o If the price breaks the resistance upwards → BULLISH Signal (green triangle) 🟢
o If the price breaks the support downwards → BEARISH Signal (red triangle) 🔴
Smart filter: 🧠
• For a bullish signal: The price must first be below the pivot, then rise
• For a bearish signal: The price must first be above the pivot, then fall
• This eliminates false signals when the price is already far from the range ❌
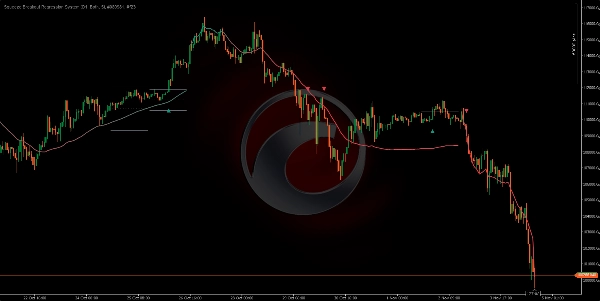
PART 2: Regression Trend Channel
It mathematically calculates the optimal trend line using linear regression and draws a dynamic channel with:
• Thick central line (green if rising, red if falling) 🎨
- Breakout Alerts 🚨
Show Breakout Signals
• What it does: Shows/hides the signal triangles
• Impact: If you deactivate it, you won't see the arrows but the boxes and lines will remain visible
• Recommendation: Always activated ✅
Bullish/Bearish Breakout Color
• What it does: Changes the color of the bullish/bearish signals
• Impact: Visual only, does not affect detection
• Recommendation: Green for bullish, Red for bearish (standard) 🟢🔴 - Trend Channel (Trend Channel) 📊
Channel Method
• Options: Rolling / Static
• What it does:
o Rolling: The channel adapts bar by bar (fluid) 🔄
o Static: The channel is drawn once at the start of the period and extended (straight line) ➖
• Impact: Rolling is more dynamic, Static is clearer for seeing the initial trend
• Recommendation: Rolling for real-time tracking ⌚
Anchor Type
• Options: Periodic / First Bar
• What it does:
o Periodic: Resets the calculation each new period (weekly, monthly, etc.) 📅
o First Bar: Calculates from the first bar on the chart (never resets) 🏁
• Impact: Periodic gives clean channels each period, First Bar shows the global trend
• Recommendation: Periodic for structured analysis 🧱
Channel Period
• What it does: How often the channel calculation resets
• Default: Weekly (Weekly) 🗓️
• Impact:
o Short periods (Daily) → Channel changes frequently, follows rapid changes
o Long periods (Monthly) → More stable channel, shows underlying trend
• Recommendation: Weekly is the perfect balance ⚖️
Price Source
• Options: Close / Open / High / Low / Typical / Weighted
• What it does: Which price it uses to calculate the channel
• Impact: Close is the most used (closing price), Typical smoothens the calculation
• Recommendation: Close for precision, Typical for smoothing 🎯
Deviation Multiplier
• What it does: Multiplies the standard deviation to make the channel wider or narrower
• Default: 1.0
• Impact:
o Low values (0.5-0.8) → Narrow channel, more touch signals but also more false ones
o High values (1.5-2.0) → Wide channel, fewer touches but more reliable
• Recommendation: 1.0 is the optimal balance ⚖️ - Channel Colors 🎨
Dynamic Colors
• What it does: Changes the channel color according to the trend (green if rising, red if falling)
• Impact: If you deactivate it, it uses only one color (Uptrend Color)
• Recommendation: Activated to quickly identify trend 🚦
Uptrend/Downtrend Color
• What it does: Defines the colors for uptrend/downtrend
• Impact: Visual only
• Recommendation: Green/Red (classic) 🟢🔴
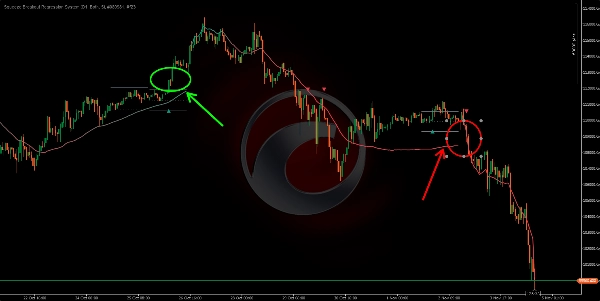
🟢 LONG OPERATION 📈
- Squeeze Detection:
• The 3 horizontal lines appear (support, pivot, resistance)
• The price is compressed between these levels - Breakout Preparation:
• The price is below the pivot (central dotted line)
• This activates the condition to look for bullish breakouts - KEY CONFLUENCE - Entry Moment: 🎯
• ✅ Green triangle appears (bullish breakout confirmed) 🟢
• ✅ Regression Channel is GREEN (uptrend confirmed) 📗
• ✅ Price breaks the upper squeeze line ↗️
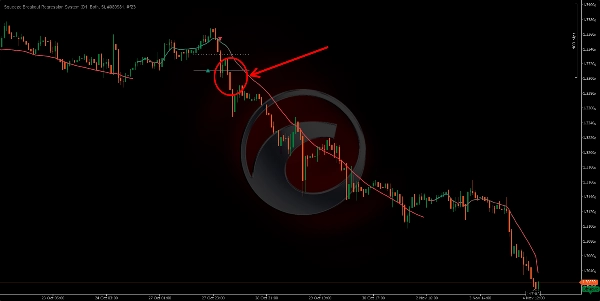
🔴 SHORT OPERATION 📉
- Squeeze Detection:
• The 3 horizontal lines appear again
• New compression zone identified - Bearish Breakout Preparation:
• The price is above the pivot (dotted line)
• This activates the search for bearish breakouts - KEY CONFLUENCE - Entry Moment: 🎯
• ✅ Red triangle appears (bearish breakout confirmed) 🔴
• ✅ Regression Channel is RED (downtrend confirmed) 📕
• ✅ Price breaks the lower squeeze line ↘️
Summary
The Trend Channel System uses linear regression to calculate the dominant trend and dynamically draws a channel with color-coded trend direction (green for uptrend, red for downtrend). It offers configurable options such as rolling or static channels, periodic or continuous anchoring, channel period, price source, and deviation multiplier to adjust channel width and responsiveness.
The indicator supports breakout alerts with visual signals for bullish and bearish breakouts, aiding traders in timing entries. It is applicable across various markets including Forex, cryptocurrencies, stocks, and indices, with symbols like BTCUSD, EURUSD, GBPUSD, XAUUSD, NAS100, and USDJPY. The system integrates volatility compression detection with trend analysis to assist in identifying breakout trading opportunities.


