present
Sign up and get $50 off your first purchase
Trading product for CandleColourFlow EURCAD Demo 1.1 UPGRADE Indicator Forex Signal, image 1
CandleColourFlow EURCAD Demo 1.1 UPGRADE
Indicator
89 downloads
Version 1.0, Nov 2025
Windows, Mac
Trading product for CandleColourFlow EURCAD Demo 1.1 UPGRADE Indicator Forex Signal, image 2
Trading product for CandleColourFlow EURCAD Demo 1.1 UPGRADE Indicator Forex Signal, image 3
Trading product for CandleColourFlow EURCAD Demo 1.1 UPGRADE Indicator Forex Signal, image 4
Trading product for CandleColourFlow EURCAD Demo 1.1 UPGRADE Indicator Forex Signal, image 5
Trading product for CandleColourFlow EURCAD Demo 1.1 UPGRADE Indicator Forex Signal, image 6
Since 25/02/2025
2
Sales
277
Free installs

Description

📌 CandleColourFlow_EURCAD_DEMO_1_1 – Demo Version (UPGRADE)

CandleColourFlow is an innovative indicator designed to clearly and quickly highlight trend direction and momentum strength in the Forex market.
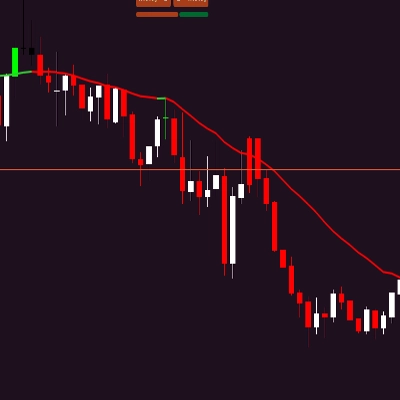
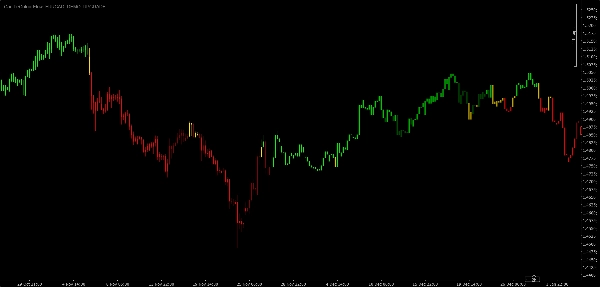
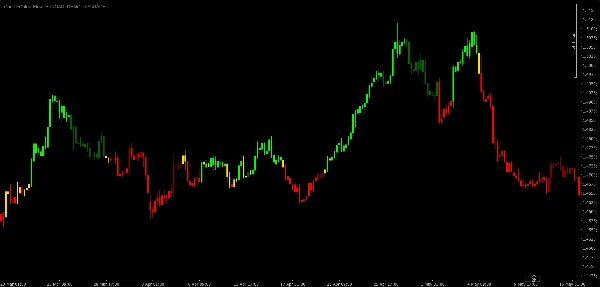
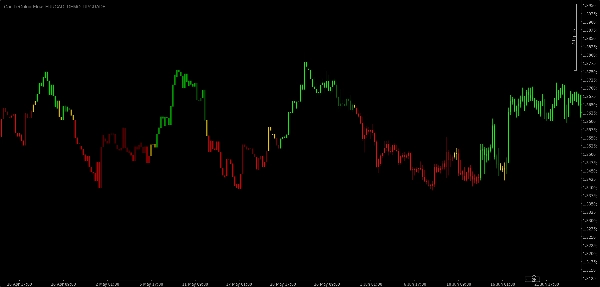
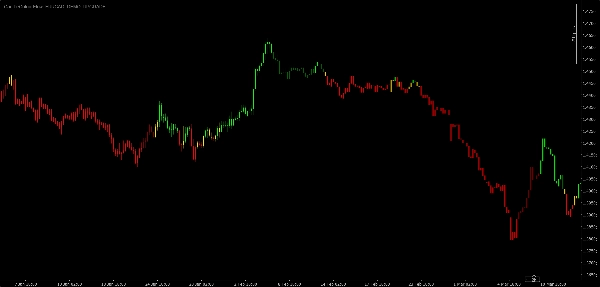
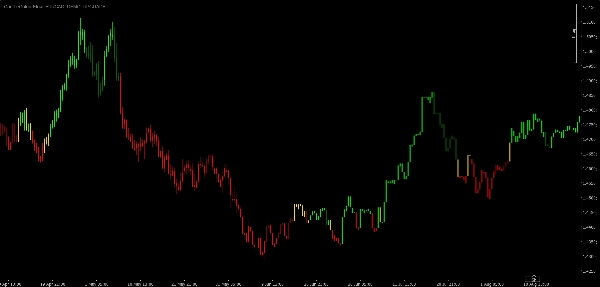
The EURCAD Demo 1.1 (Upgrade) version features improved candle coloring that helps identify impulses, slowdowns, and neutral zones with high visual clarity.


🔹 Candle Color System (Demo Version)

Bright Green – strong bullish impulse

Indicates clear buyer dominance and supports holding or opening long trades.

Dark Green – weakening bullish trend

Momentum is fading.
This may signal a potential exit opportunity after a sustained upward move.

Bright Red – strong bearish impulse

Selling pressure is dominant and favors continuation of short trades.

Dark Red – weakening bearish trend

Momentum is losing strength.
This can indicate a possible end of the move, suitable for closing short positions.

Gold Candles – neutral market

No clear directional advantage.
Often appears during consolidation or a pause before continuation.


💡 What makes CandleColourFlow Demo 1.1 unique?

  • Instant visual assessment of trend strength (bright vs. dark colors)
  • Helps traders quickly evaluate market conditions without multiple indicators
  • Simple and intuitive for beginners
  • Clean, distraction-free demo version

⚠️ Legal Disclaimer

This indicator is intended for educational purposes only.
It does not constitute financial advice or a recommendation to execute trades.

Summary

AI summary
CandleColourFlow EURCAD Demo 1.1 UPGRADE is a Forex indicator designed to visually highlight trend direction and momentum strength on EURCAD charts. It uses a color-coded candle system to indicate market impulses and slowdowns: bright green signals strong bullish momentum, dark green indicates weakening bullish trends, bright red shows strong bearish momentum, dark red signals weakening bearish trends, and gold candles represent neutral or consolidating markets. This upgraded demo version improves candle coloring for clearer identification of impulses, slowdowns, and neutral zones. The indicator enables quick visual assessment of trend strength without the need for multiple tools, making it accessible for both beginners and experienced traders. It is intended for educational purposes and does not provide financial advice or trade recommendations.
Indicator profile

Customer reviews

0.0
Reviews: 0
Customer reviews
No reviews for this product yet. Already tried it? Be the first to tell others!

Discussion

FAQ

Forex
Signal
Supertrend
Products available through cTrader Store, including trading bots, indicators and plugins, are provided by third-party developers and made available for informational and technical access purposes only. cTrader Store is not a broker and does not provide investment advice, personal recommendations or any guarantee of future performance.

More from this author

Indicator
CandleColourFlow – smart color-coded trend indicator.
Indicator
CandleColourFlow MultiFx - optimized to work on Fx Majors, Fx MInors, Fx Crosses
Indicator
Forex
EURUSD
+5
Advanced multi-pair indicator that enhances trend clarity and momentum reading across all major and minor Forex symbols.

You may also like

Indicator
Volume
Imbalance
+5
Spot Institutional Order Flow with Proportional Volume Bubbles & Integrated Cumulative Volume Delta (CVD) Intelligence.
Indicator
Forex
BTCUSD
+11
Catch High-Probability Reversals with Precision Swing
Indicator
ATR
RSI
+5
Delta RSI Candle Pro, the indicator that transforms ordinary candlesticks into powerful momentum visualizers.
Indicator
It draws a step line that visualize the movement of H4. Particularly effective when trade on lower timeframe.
Indicator
BOS
CHOCH
+3
Identifies HH, HL, LH, and LL swing points using fractals. Essential for Smart Money Concepts and price action.
Indicator
EMA
Supertrend
+4
Dynamic dual MA cloud indicator. Identifies trends, crossovers, and pullback entries in real time for any asset.
Indicator
EMA
A visual signal backtester that simulates trades directly on your chart and scores strategy performance.
Indicator
CHOCH
Key Levels
+4
Real-time compliance dashboard for prop firm challenges. Tracks daily loss, max drawdown, and profit target.
"IVB 2.0" logo
Top-rated
4.6
(5)
$19
Indicator
IVB 2.0 is an indicator that works on the strategy of imbalance of the maximum volatility box of indices
Indicator
Forex
Indices
+1
Detects HTF bias using CRT, Expansion & Swing Point patterns with SMT/PSP divergence — visualised in a floating candle
Indicator
ATR
RSI
+6
📊Zones Supply & Demand: Identifies key price levels with high volume concentration, marking Supply/Demand Zones & Marke
Indicator
Prop
Forex
+4
Draws pivots (P, S/R, CPR) from selected anchors like H1–Month1, with optional mid-levels (PS1, S1S2, etc.)
Indicator
ATR
The Tenkan-ATR Indicator is a powerful and innovative indicator for Traders. SALE OFF!!!
Indicator
Indices
this indicator shows previous day high low and closed with precise manner.
Indicator
Plot higher-timeframe Bollinger Bands for clearer structure, pullback zones, and breakout signals—without switching char
Indicator
Market Structure
Stop guessing which trading session you in, with Sessions indicator sessions are in your finger tips like a pro
Indicator
E7 Volume Profile, more modern look and feel.
Indicator
ATR
EMA
+5
The indicator displays potential reversal zones (support/resistance) on the chart based on the average range (High–Low)

Price

Since 25/02/2025
2
Sales
277
Free installs