CandleColourFlow_Limited_EURUSD
"CandleColourFlow_Limited_EURUSD" logo
03/09/2025
51
Desktop
Since 25/02/2025
Free installs
51

📌 CandleColourFlow_Limited_EURUSD – Demo Version

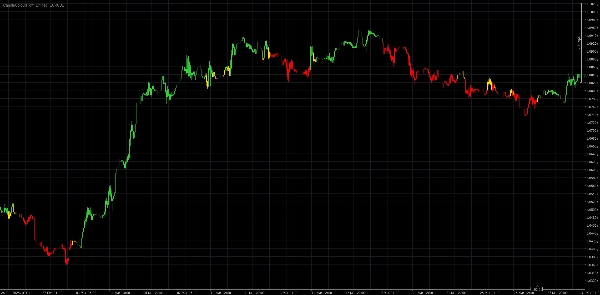
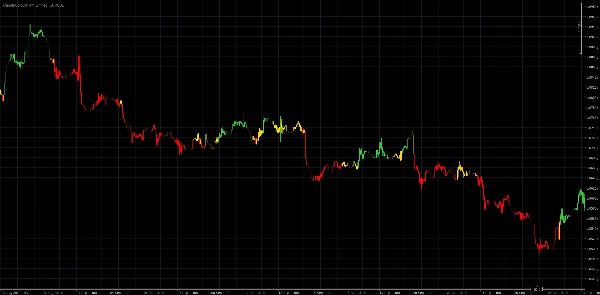
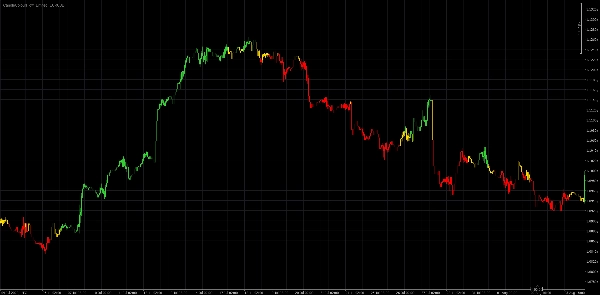
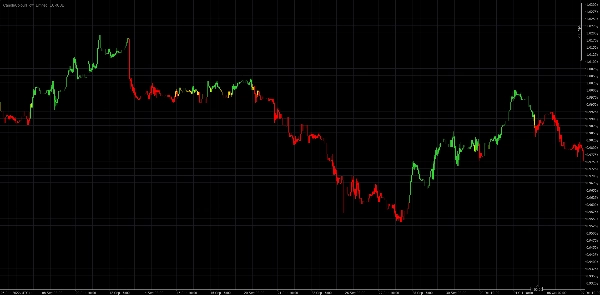
CandleColourFlow is an innovative indicator designed to clearly and quickly identify trends and market turning points on the Forex market. With its simple and intuitive color system, even beginner traders can make more informed trading decisions.

🔹 Green candles – suggest a favorable condition for opening long positions
🔹 Red candles – suggest a potential short trade opportunity
🔹 Gold candles – signal market indecision: potential consolidation or trend continuation

💡 What makes CandleColourFlow unique?

  • Clear visual insight into market conditions without needing multiple indicators
  • Automatic detection of momentum shifts and price structure changes
  • Perfect for quickly assessing the overall market state

⚠️ Legal Disclaimer:
This indicator is intended for educational purposes only. It does not constitute investment advice or a recommendation to execute any financial transactions.

Looking for more?
Additional versions of CandleColourFlow are coming soon – each with unique features and broader market support.

More from this author
CandleColourFlow_MultiFx
CandleColourFlow MultiFx - optimized to work on Fx Majors, Fx MInors, Fx Crosses
You may also like
Indicator
NAS100
NZDUSD
XAUUSD
+10
Nebula Range Filter Pro
⚡Nebula Range Filter is a professional trend filter indicator for cTrader⚡
Indicator
VWAP
Breakout
Scalping
VWAP & Sessions & D,W,M HLO Levels
Killzone Session With VWAP – Precision Meets Price Action
Indicator
NAS100
NZDUSD
Breakout
+13
Meridian Pivot Points Pro
🚀See the market’s framework, decide faster. Session-Aware Pivots. Auto Presets. Pro-Grade Zones.🚀
DMI MONDAY ZONES v2.1
Marks Monday's OPEN,HIGH & LOW. These are areas of support and resistance for the week.
EURUSD Breakout Indicator
Breakout Multi-Timeframe Strategy Indicator
VWAP Tokyo Open
VWAP Set to Tokyo Open
Weekly Daily Levels
The Weekly Daily Levels indicator shows the OHLC, and mid-point prices for the previous day and week.
Indicator
Stocks
Forex
Signal
+1
Engulfing Pattern Indicator
Indicator
RSI
Indices
StochasticRSI
Stochastic RSI (StochRSI) is a technical indicator used to measure the strength and weakness of the RSI.
Indicator
NAS100
Indices
Breakout
+9
WyckoffSimple
📊 🚀 “Anticipate the Market with Wyckoff Smart Zones – Discover Where Institutions Buy and Sell”
Bar Explosion
cTrader indicator with mini-timeframe candlesticks. Customize timeframe, colors, margins. Perfect for traders.
Quantitative Qualitative Estimation
The QQE (Quantitative Qualitative Estimation) Weighted Oscillator improves its original version by weighting the RSI.
Indicator
NAS100
Indices
NZDUSD
+9
RT Relative Moving Average
Bring the RMA to cTrader! This is the Relative Moving Average from TradingView.
Indicator
Indices
ATR
Forex
+1
[Stellar Strategies] Market Regime Filter
Filters market regimes (trend/range/pullback) using MAs, ADX, ATR/BBW Vol, opt. Volume. Helps adapt strategy. 📉📈
VolumeColorBar
Color Volume Bars – Visualize Market Strength Instantly
IR Spread
show spread on chart
Indicator
NAS100
XAUUSD
Commodities
+10
MARKET_STRUCTURE BOS_CHoCH
MarketStructurePro – Smart BOS/CHoCH
Indicator
RSI
Breakout
Supertrend
Swing Levels
🔍 Automatically detect support and resistance levels based on "swings" or pivots