Descrição
Trend Entropy – Indicador gratuito para cTrader
Entropia é a medida científica da desordem ou incerteza em um sistema. Na física, mostra como a energia se dispersa e por que os sistemas tendem ao caos. Na teoria da informação, mede a imprevisibilidade dos dados. Baixa entropia significa ordem e previsibilidade, enquanto alta entropia reflete aleatoriedade, complexidade e menor clareza dos resultados.
Descubra o poder da ordem dentro do caos. Trend Entropy é um indicador técnico avançado projetado para medir a organização versus a aleatoriedade dos movimentos de preço. Ao contrário dos osciladores tradicionais que apenas acompanham o momentum ou a volatilidade, Trend Entropy aplica cálculos avançados de entropia para revelar se o mercado está em uma tendência estruturada ou derivando para um comportamento caótico de faixa.
Esta ferramenta gratuita foi criada para traders que desejam uma visão mais profunda das dinâmicas ocultas da ação do preço. Ao combinar entropia estatística com suavização no estilo RSI e limites adaptativos, Trend Entropy transforma a volatilidade bruta em uma escala clara e normalizada de 0% a 100%. O resultado é uma linha única e elegante que indica se o mercado está em uma tendência forte, uma consolidação neutra ou uma faixa volátil.
Como Ler o Trend Entropy
Valores baixos (0–33%): O mercado está organizado. Se o retorno médio for positivo, sugere uma provável tendência de alta. Se negativo, indica uma provável tendência de baixa.
Valores médios (34–66%): Território neutro. O mercado pode estar consolidando, com uma leve inclinação para alta ou baixa dependendo do retorno médio.
Valores altos (67–100%): O caos domina. A ação do preço está em faixa, imprevisível e menos confiável para estratégias de seguimento de tendência.
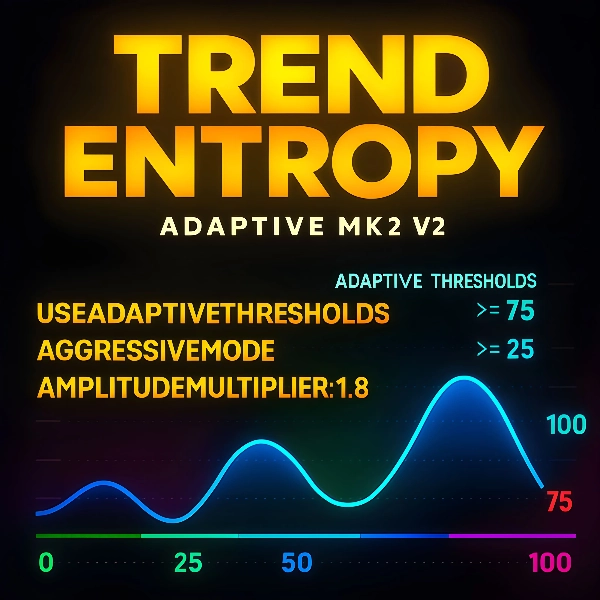
Linhas de referência horizontais em 25%, 50% e 75% facilitam a interpretação. Os traders podem ver instantaneamente se a entropia está se comprimindo em direção à ordem ou se expandindo em direção ao caos.
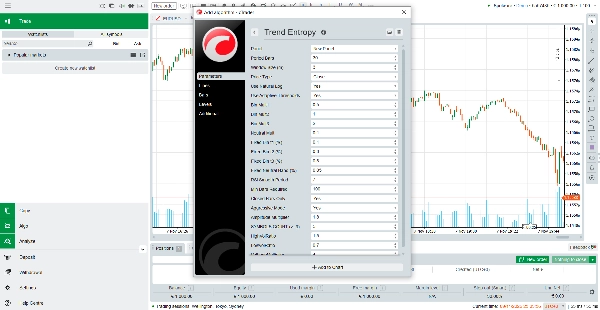
Como o Indicador Funciona
Trend Entropy calcula os retornos ao longo de um período escolhido e os mapeia em estados simbólicos. Esses estados são analisados em janelas sobrepostas para construir uma distribuição de frequência dos padrões de preço. Usando a matemática da entropia, o indicador mede o grau de desordem nessas sequências.
Para tornar o resultado prático, a entropia bruta é normalizada para uma escala percentual e então suavizada usando um método de média no estilo Wilder. Limites adaptativos garantem que o indicador se ajuste à volatilidade atual, enquanto o modo agressivo amplifica os sinais para traders que preferem respostas mais rápidas. Finalmente, razões de volatilidade são aplicadas para refinar a leitura, elevando os valores em condições caóticas e reduzindo-os em condições estáveis.
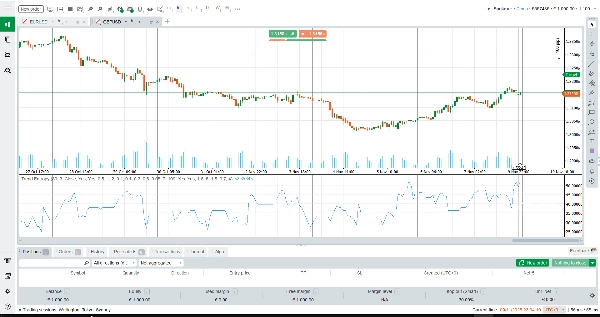
O resultado final é uma linha única suavizada que captura a essência da estrutura do mercado: se o preço está em tendência com ordem ou derivando para a aleatoriedade.
Principais Características
Análise baseada em entropia – Vai além do momentum para medir a verdadeira organização da ação do preço.
Limites adaptativos – Ajusta-se automaticamente à volatilidade, mantendo os sinais relevantes em todas as condições de mercado.
Suavização no estilo RSI – Fornece uma linha limpa e estável que evita flutuações ruidosas.
Integração de volatilidade – Aumenta a precisão comparando razões de volatilidade de curto e longo prazo.
Design visual claro – Níveis de referência horizontais e uma única linha DodgerBlue tornam a interpretação fácil.
Por Que Escolher o Trend Entropy?
Trend Entropy não é apenas mais um oscilador. É uma ferramenta híbrida que combina rigor estatístico com visualização amigável para traders. Seja você um seguidor de tendências buscando confirmação, ou um trader de faixa querendo evitar mercados caóticos, este indicador oferece a clareza que você precisa.
Resumo
The indicator outputs a single smoothed line on a normalized scale from 0% to 100%, where low values (0–33%) indicate organized trending markets, mid values (34–66%) suggest neutral or consolidating conditions, and high values (67–100%) reflect chaotic, ranging markets. Horizontal reference lines at 25%, 50%, and 75% aid interpretation.
Trend Entropy pro incorporates RSI-style smoothing, adaptive thresholds that adjust to current volatility, and volatility ratio integration to enhance signal accuracy. It is designed to provide traders with deeper insight into market dynamics beyond traditional momentum or volatility indicators, supporting analysis across various markets including Forex, cryptocurrencies, commodities, indices, and stocks.
This indicator is suitable for traders seeking to identify trending versus ranging conditions and improve decision-making in trend-following or range-trading strategies.