
ATR on Chart
Indicator
258 downloads
Version 1.0, Sep 2025
Windows, Mac
Description
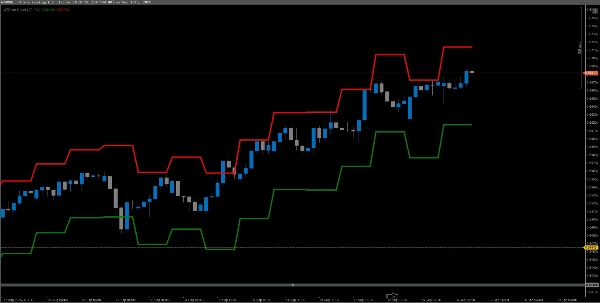
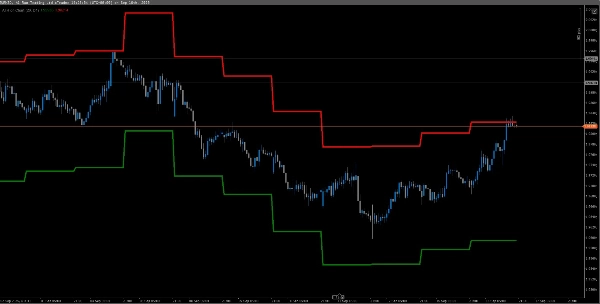
Shows the average true range. Plots the ATR on the chart for easy visualization, default time frame is the Daily but you can alter it.
Summary
AI summary
ATR on Chart is a technical indicator that displays the Average True Range (ATR) directly on the price chart for straightforward visualization. By default, it calculates ATR using the daily timeframe, though users can adjust this setting to other timeframes as needed. This indicator supports various markets including Forex, commodities, indices, and cryptocurrencies, with specific symbols such as BTCUSD, EURUSD, GBPUSD, USDJPY, and XAUUSD among others. It is designed to help traders assess market volatility by plotting ATR values visually, facilitating easier interpretation of price movement ranges.
Indicator profile
Customer reviews
0.0
Reviews: 0
Customer reviews
No reviews for this product yet. Already tried it? Be the first to tell others!
Discussion
FAQ
BTCUSD
Forex
Signal
Indices
EURUSD
Commodities
GBPUSD
Crypto
XAUUSD
ATR
USDJPY
Products available through cTrader Store, including trading bots, indicators and plugins, are provided by third-party developers and made available for informational and technical access purposes only. cTrader Store is not a broker and does not provide investment advice, personal recommendations or any guarantee of future performance.


Price
Since 11/09/2025
258
Free installs