"Price Magnet" logo
Indicator
Version 1.0, Feb 2026
Windows, Mac
4.2
Reviews: 4
"Price Magnet" uploaded image
Since 17/02/2026

Price Magnet: Advanced Price Density & Institutional Levels

Price Magnet is a professional-grade analytical tool for cTrader designed to reveal where "Smart Money" accumulates positions. Unlike standard oscillators or trend indicators, Price Magnet uses a mathematical approach to identify zones of maximum market interest by calculating Price Density.

How It Works

The market often returns to levels where it has spent the most time. These are the "Magnets". This indicator scans a specific historical depth, clusters price action into frequency groups, and highlights the strongest levels that are likely to act as future magnets for the price.

Detailed Parameter Guide

To get the most out of Price Magnet, it is essential to understand its configuration:

  • Analysis Depth (Bars): Determines how many historical candles the indicator analyzes.
    • Short-term (50-100): Best for scalping and day trading.
    • Long-term (300-500): Best for identifying major institutional "S&R" zones.
  • Back Shift: Allows you to shift the analysis window back into the past. Useful for backtesting how historical density zones influenced subsequent price movements.
  • Grouping Step (Price): The most critical setting. It defines the "sensitivity" of the magnet.
    • For EURUSD, a step of 0.0001 (1 pip) or 0.0002 is recommended.
    • For Gold (XAUUSD), try 0.5 or 1.0.
    • For Bitcoin, use 50 or 100.
  • Price Source: Choose which part of the candle to analyze.
    • Close: Standard analysis.
    • Median / Typical: Often more accurate as it accounts for the entire range of the candle.
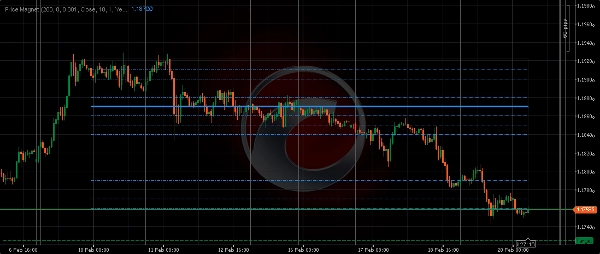
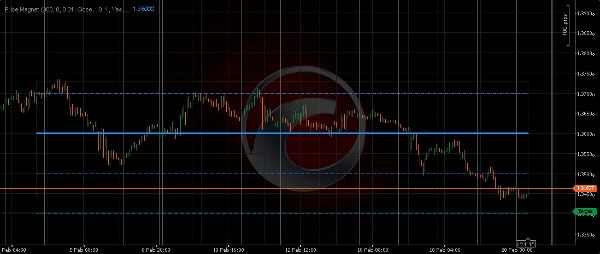
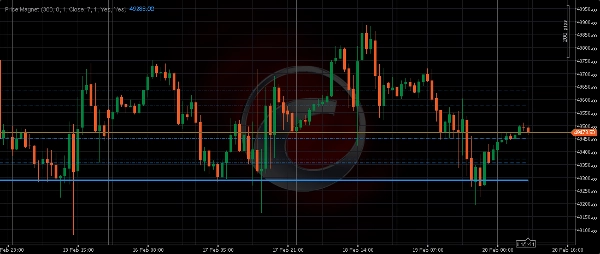
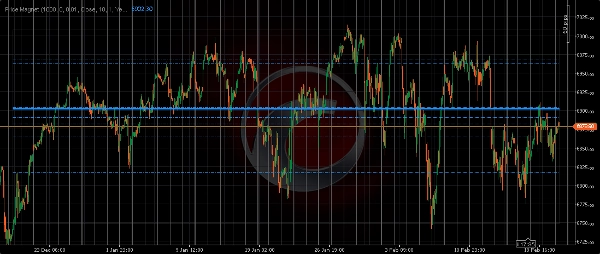
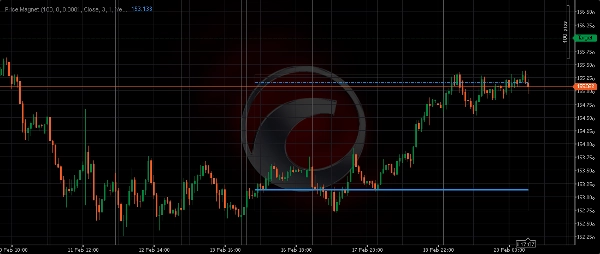
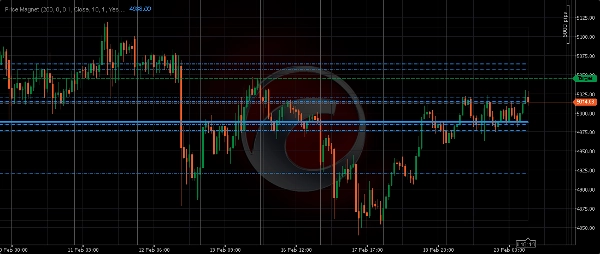
  • Levels To Display: Defines how many magnetic levels to draw (from 1 to 10). The most frequent level is always drawn with a thicker line.
  • Visual Settings (Show Density Zone/Lines): Toggle the background rectangle (Zone) and horizontal lines. The Zone represents the total boundaries of the analyzed price action, providing a clear visual of the current trading range.

Trading Strategy Tips

  1. Mean Reversion: When the price deviates significantly from the "Main Magnet Line," look for exhaustion signals to trade a return to the magnet.
  2. Breakout Confirmation: If the price breaks through a strong Magnet Level and retests it, that level often flips from resistance to support.
  3. Take Profit Targets: Use secondary magnetic levels as objective targets for your trades.

Price Magnet simplifies complex market profile data into actionable visual levels, giving you a professional edge in any market condition.

Indicator profile
4.2
Reviews: 4
5
50 %
4
25 %
3
25 %
2
0 %
1
0 %
Customer reviews
March 3, 2026
A decent setup here should survive 3 to 5 levels without looking messy. The journal should show whether the numbers are real.
March 3, 2026
tbh the value is mostly in filtering bad ideas. I still would not trust it live without checking the chart myself. Light sizing makes the early sample easier to judge.
March 2, 2026
This fits key price zones better as a review layer. The first forward check can be 13 setups on M1, with 2 reactions and manual notes.
February 28, 2026
this feels useful if the user already has a plan. The main value is planning entries around structure, not chasing every signal that appears.
BTCUSD
Forex
Signal
Breakout
Indices
EURUSD
Commodities
GBPUSD
NZDUSD
Fibonacci
Prop
ZigZag
Scalping
Fair Value Gap
SMC
Crypto
XAUUSD
NAS100
USDJPY
VWAP
Products available through cTrader Store, including trading bots, indicators and plugins, are provided by third-party developers and made available for informational and technical access purposes only. cTrader Store is not a broker and does not provide investment advice, personal recommendations or any guarantee of future performance.

More from this author

Indicator
ATR
SMC
+18
Pulse Radar is a precision C#-based tool for tracking price momentum and cyclical shifts using adaptive high-speed and s
Indicator
SMC
BTCUSD
+10
Auto-marks key Highs/Lows. Spot swing points & market structure instantly. Fully customizable for any timeframe.
Indicator
SMC
Prop
+14
Macro Matrix: Sync high-order market flows with your current chart. Decode trend hierarchy and macro structure.
Indicator
ATR
SMC
+17
Advanced trend indicator using macro-period volatility analysis to identify key institutional price levels.
Indicator
ATR
SMC
+17
Professional ZigZag Fibonacci tracer. Automated institutional level detection with dynamic market structure mapping.
Indicator
ATR
RSI
+19
AxiomPoint: Professional momentum tracker using triple-phase filtering logic for precise trend entry points.
Indicator
ATR
SMC
+17
Undametrics: Professional trend-following indicator with precise step-levels and real-time reversal signals.

You may also like

Indicator
BOS
MSS
+3
Advanced indicator to highlight key execution context and help aligning structure, location, and risk.
Indicator
AI
Prop
+7
EMA Clouds, Multi-Timeframe (MTF) Overlay, Swing High/Low detection, and a smart Dashboard with neutral zone filtering.
Indicator
It draws a step line that visualize the movement of H4. Particularly effective when trade on lower timeframe.
Indicator
Forex
NZDUSD
+2
RCS: 8 majors! AUD,USD,EUR,JPY,GBP,CAD,CHF,NZD. Find how strong each currency is relatively and trade smarter!
Indicator
ATR
SMC
+5
Candles Volume Delta is a powerful, visually intuitive indicator that transforms raw tick volume into actionable trading
Indicator
Channel
Key Levels
+1
Trend channel + price forecast + automatic support & resistance zones Knows where the price is going.
Indicator
Prop
Forex
+4
Draws pivots (P, S/R, CPR) from selected anchors like H1–Month1, with optional mid-levels (PS1, S1S2, etc.)
Indicator
SMC
VWAP
+16
It calculates Anchored VWAP and StdDev bands from a user-defined start date for cTrader charts.
Indicator
Channel
Moving Average
+2
This is a high-quality implementation of the Squeeze Momentum Candle logic applied directly to candle coloring.
Indicator
MACD
Prop
+14
Enhance MACD Histogram! Visualize bull and bear price changes with vibrant colors for clearer, more insightful trading.
Indicator
SMC
Prop
+19
Most advanced Volume Profile Pivot Box indicator — auto pivots, volume zones, smart candle coloring & SMC trading tool.
Indicator
CHOCH
Key Levels
+5
ZigZag Market Structure Identifier - Multi-Layer Scanner: Convergent Pivot Detection, 4-TF Overlay & Naked Chart Mode.
Indicator
Prop
VWAP
+13
Rolling VWAP with dynamic or fixed time window, customizable source price and standard deviation bands.
Indicator
Color-Based Market Pressure & Volatility Visualizer The Kandika Heatmap Indicator
Indicator
ATR
SMC
+18
Precision SMC tool with HTF sweeps, MSS confirmation & smart FVG detection for high-probability reversals.
Indicator
AI
ATR
+18
Scalping signals with EMA/RSI/ATR logic. Visual cloud shows precise entry and exit zones. Built for M1/M5 scalpers.
Indicator
RSI
MACD
Unlock market insights with our Multi-Timeframe Market Levels indicator, enhancing your trading strategies effortlessly
Indicator
AI
ATR
+12
The standard Relative Strength Index (RSI), RSI & Signal Cloud, Smart Volatility Filter (ATR), On-Chart Info Dashboard
Since 17/02/2026