HiLo Marker
Indicator
Version 1.0, Feb 2026
Windows, Mac
"HiLo Marker" uploaded image"HiLo Marker" uploaded image"HiLo Marker" uploaded image"HiLo Marker" uploaded image"HiLo Marker" uploaded image"HiLo Marker" uploaded image"HiLo Marker" uploaded image"HiLo Marker" uploaded image
Since 17/02/2026
About trial version
This is a 7-day trial version of HiLo Marker indicator. Limitations: ✅ Works only on NZDSEK symbol ✅ 7-day trial from first installation ✅ Full functionality After 7 days, the indicator stops displaying. Purchase the full version for unlimited use on all symbols.

HiLo Marker: Uncover Key Market Turning Points

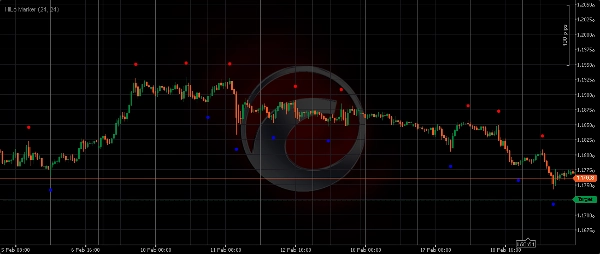
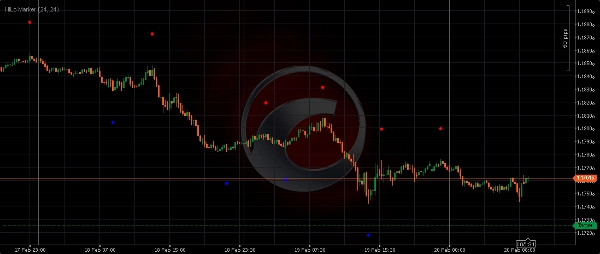
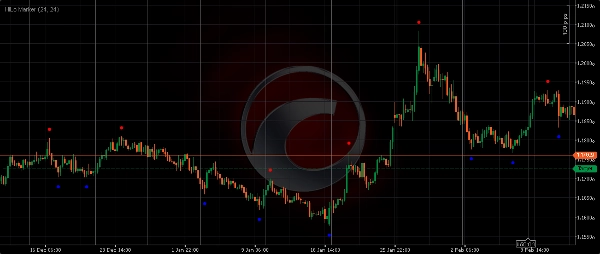
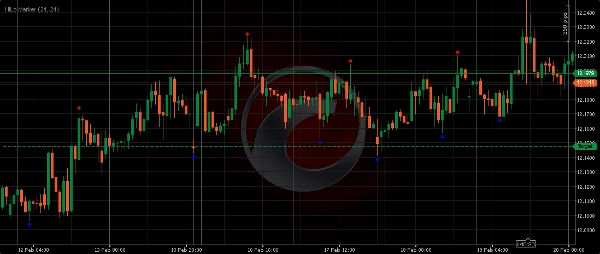
HiLo Marker is an intuitive and essential cTrader indicator designed to automatically detect and highlight significant price Highs and Lows based on a defined historical window. This tool brings clarity to your charts by removing the guesswork from identifying swing points, offering a visual edge for any price action trader.

How It Works

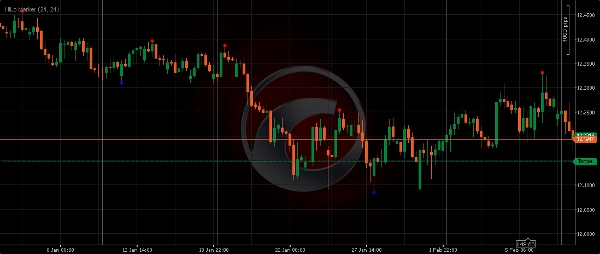
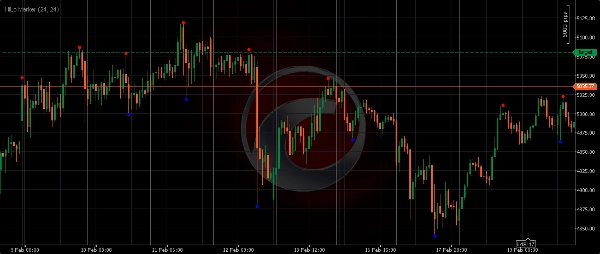
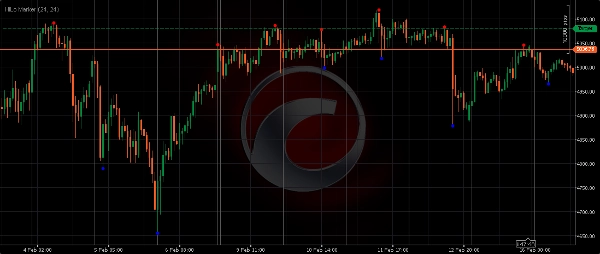
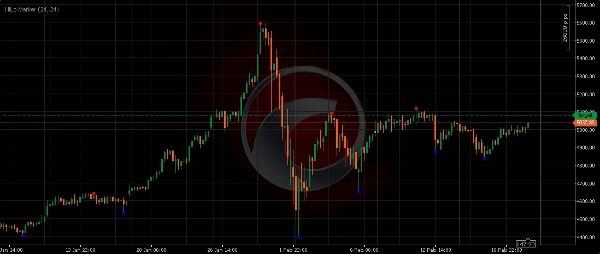
The indicator scans a specified "Distance Window" (number of bars) to find the absolute highest High and lowest Low within that range. Once a bar is confirmed as the peak or trough of its surrounding window, HiLo Marker places a distinct red or blue dot (or arrow) above/below that candle. This method helps you objectively pinpoint crucial levels where price previously reversed or found strong momentum.

Key Features & Benefits

  • Automated Precision: No more manually drawing lines. HiLo Marker objectively identifies critical turning points.
  • Clear Market Structure: Instantly visualize swings, trends, and ranges, making chart analysis more efficient.
  • Support & Resistance Zones: The marked highs and lows frequently act as future support and resistance, offering high-probability entry/exit points.
  • Versatile: Works flawlessly across all financial instruments (Forex, Gold, Indices, Crypto, Stocks) and on any timeframe.
  • Customizable Visuals: Adjust marker colors and offset distance for perfect chart integration.

Input Parameters Explained:

  • Length (Offset): This value determines how far above the High or below the Low the marker will be plotted. A larger value creates more visual separation from the candle.
    • Example: Length = 24 means the marker will appear 24 pips (or ticks, depending on the symbol) away from the actual High/Low.
  • Distance Window: This is the look-back period the indicator uses to identify a High or Low. A bar is only marked as a Hi/Lo if it is the absolute highest/lowest within this specified number of surrounding bars.
    • Smaller Dist (e.g., 10-20): Captures minor swings and short-term market noise (suitable for scalping).
    • Larger Dist (e.g., 30-60+): Identifies more significant, institutional-level swings and major trend reversals (ideal for swing trading or higher timeframes).

Enhance your price action trading with HiLo Marker. Gain a clearer perspective of market dynamics and make more informed decisions. Download now!

0.0
Reviews: 0
Customer reviews
No reviews for this product yet. Already tried it? Be the first to tell others!
ZigZag
NAS100
NZDUSD
XAUUSD
Fibonacci
Signal
EURUSD
GBPUSD
BTCUSD
USDJPY
SMC
Scalping

More from this author

Indicator
NAS100
NZDUSD
XAUUSD
+17
Pulse Radar
Pulse Radar is a precision C#-based tool for tracking price momentum and cyclical shifts using adaptive high-speed and s
Indicator
NAS100
NZDUSD
XAUUSD
+17
Price Magnet
Price Magnet finds hidden institutional zones by price density. High-precision support and resistance levels.
Indicator
NAS100
NZDUSD
XAUUSD
+13
Macro Matrix
Macro Matrix: Sync high-order market flows with your current chart. Decode trend hierarchy and macro structure.
Indicator
NAS100
NZDUSD
XAUUSD
+16
Vortex
Advanced trend indicator using macro-period volatility analysis to identify key institutional price levels.
Indicator
NAS100
NZDUSD
Breakout
+16
Apex Fibo Tracer
Professional ZigZag Fibonacci tracer. Automated institutional level detection with dynamic market structure mapping.
Indicator
Grid
NAS100
RSI
+18
Axiom Point
AxiomPoint: Professional momentum tracker using triple-phase filtering logic for precise trend entry points.

You may also like

Indicator
Indices
Breakout
Prop
+6
pjsKalmanTrend
Self-adapting Kalman filter for cTrader. Smooth trend line with color shifts, optional histogram, no nag screens.
Indicator
RSI
MACD
sarah trend
Un indicateur tout-en-un intelligent qui détecte la tendance, donne un avis clair (achat/vente)
Indicator
Grid
NAS100
NZDUSD
+18
MAQuantVolumeProfileCustomRange
The MA Quant Volume Profile Custom Range is a trading indicator that analyzes volume distribution across the price
E7 Correlation Dashboard
E7 Correlation Dashboard.
Indicator
NAS100
RSI
NZDUSD
+13
DeepScalp Pro Ai
🦅 Institutional Trading System with AI Gatekeeper. Detect Order Blocks, Volume Profile & PUMP/DUMP signals in real-time
Indicator
Breakout
Signal
SMC
Free_ICT Breakers_BOS_MSS_withSourceCode
ICT Breakers (BOS/MSS) - Professional market structure and breakout detection tool.
Indicator
Indices
Prop
Stocks
+3
[Hamster-Coder] Price
Indicator designed to calculate and manipulate price inputs (sources) in real time
Bollinger Bands Breakout Oscillator (+ Alerts)
BB Breakout Oscillator with alerts! Spot trend reversals using Bollinger Bands. Bullish/Bearish crossovers Alerts.
Indicator
RSI
Breakout
XAUUSD
+5
Supertrend
💹 Define a price channel 📈 and determine trend direction (bullish 🟢 or bearish 🔴).
Indicator
RSI
XAUUSD
ATR
+3
RSI NextGen
The RSI NextGen is an advanced and modernized version of the classic Relative Strength Index (RSI)
IR Candle Open
IR Candle Open plots customizable opening price lines for daily, weekly, and monthly candles
Indicator
NAS100
NZDUSD
XAUUSD
+11
Volume Profile Pro
Visualize trading volume by price within any range, highlight POC and key value areas.
Since 17/02/2026