present
가입하고 첫 구매 시 $50 할인을 받으세요
Trading product for Fixed Range Volume Profile - Manual 지표 Key Levels Volume, image 1
Fixed Range Volume Profile - Manual
지표
버전 1.0, Oct 2026
Windows, Mac
Trading product for Fixed Range Volume Profile - Manual 지표 Key Levels Volume, image 2
Trading product for Fixed Range Volume Profile - Manual 지표 Key Levels Volume, image 3
Trading product for Fixed Range Volume Profile - Manual 지표 Key Levels Volume, image 4
가입일 16/09/2026

설명

고정 범위 볼륨 프로필 - 매뉴얼은 선택한 시간 범위 내에서 가격별로 틱 관측치를 그룹화하는 cTrader 차트 지표입니다. 전체 버전은 프로필과 함께 제어점(POC), 가치 영역 상한(VAH) 및 가치 영역 하한(VAL)을 표시합니다.


범위 선택


전체 지표를 차트에 추가한 다음 시작 및 종료 수직선을 이동하여 검사하려는 기간을 선택합니다. 프로필과 해당 수준은 해당 범위에 대해 다시 계산됩니다. 차트 패널에는 선택한 범위, 포함된 틱 관측치 수, POC, VAH 및 VAL 가격이 표시됩니다.


프로필 구성


- 행 수: 12–100 가격 행; 기본값 32.

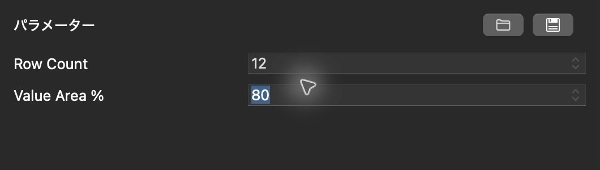
- 가치 영역 %: 50–95%; 기본값 70%.


POC는 가장 많은 틱 관측치가 있는 가격 행을 표시합니다. 가치 영역은 POC에서 인접 행으로 확장되어 구성된 관측치 비율을 포함합니다. VAH와 VAL은 그 상한과 하한을 표시합니다.


데이터 이해하기


사용 가능한 각 틱은 매수호가와 매도호가 가격의 중간 지점에서 하나의 관측치를 제공합니다. 이는 틱 활동의 프로필이며, 거래소 거래량, 매수/매도량 또는 주문 흐름 델타가 아닙니다.


이 지표는 최신 100,000개의 사용 가능한 틱까지 검사하며 선택한 시간 범위 내의 틱을 포함합니다. 따라서 결과는 중개인의 틱 기록과 cTrader에 로드된 데이터에 따라 달라집니다. 범위를 선택해도 해당 기간에 대한 완전한 틱 기록이 보장되지는 않습니다.


시작하기


1. 구매한 지표를 구매에 사용한 동일한 cTrader ID로 cTrader 데스크톱에 설치합니다. Algo > Indicators를 열고 Fixed Range Volume Profile - Manual을 선택한 후 심볼과 시간대에 대한 인스턴스를 추가합니다. 차트 지표 선택기를 통해서도 첨부할 수 있습니다.

2. 인스턴스 매개변수 패널에서 행 수와 가치 영역 %를 설정하거나 기본값을 유지합니다. 행 수는 가격 구간 해상도를 변경하며, 가치 영역 %는 가치 영역에 사용되는 틱 관측치 비율을 변경합니다.

3. 지표의 시작 및 종료 수직선을 선택하고 드래그하여 시간 범위를 선택합니다. 경계선을 이동한 후 오른쪽 상단 패널에 표시된 범위 날짜를 확인하세요.

4. 차트 패널에서 선택한 범위와 틱 수와 함께 프로필, POC, VAH 및 VAL을 읽습니다.


이 지표는 분석 도구입니다. 거래를 실행하거나 관리하지 않으며 표시된 수준에서 가격 반응을 예측하지 않습니다.


스크린샷 읽기


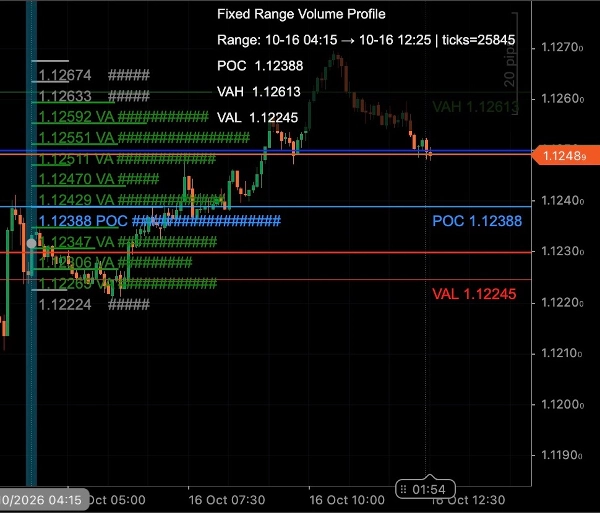
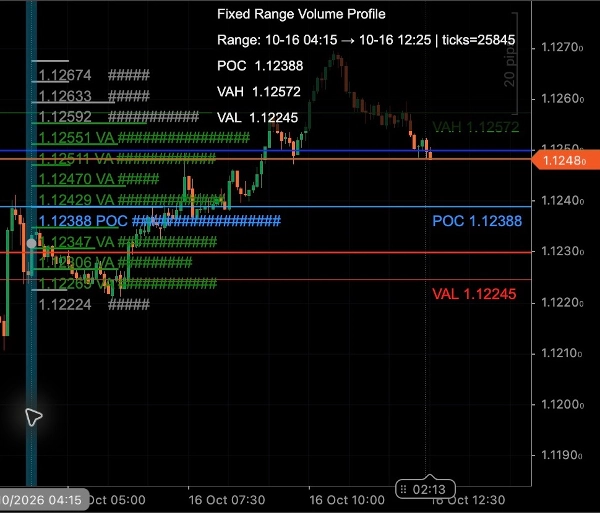
70% 가치 영역 차트는 선택한 범위와 70% 가치 영역에서의 수평 틱 활동 프로필을 보여줍니다. 80% 가치 영역 차트는 80% 가치 영역과 함께 POC, VAH 및 VAL을 표시합니다. 파란색은 POC, 녹색은 가치 영역 행과 VAH, 빨간색은 VAL을 표시합니다. 회색 행은 가치 영역 밖에 있습니다. 설정 이미지에는 80% 예제에 대해 12와 80으로 설정된 실제 행 수 및 가치 영역 % 컨트롤이 표시됩니다. 이는 기본값이 아닌 예제 설정입니다. 차트에는 일반 가격 캔들과 현재 가격 표시기도 포함되어 있으며, 지표는 거래 신호를 생성하지 않습니다.


제한 사항


틱 활동은 중개인이 제공하는 호가 업데이트를 설명하며, 거래된 계약 수나 주식 수를 의미하지 않습니다. 중개인과 사용 가능한 기록에 따라 다른 프로필이 생성될 수 있습니다. 오래되었거나 사용 불가능한 기록은 선택한 범위를 불완전하게 만들 수 있습니다. 표시된 수준은 선택된 관측치를 설명하며 보장된 지지, 저항 또는 미래 가격이 아닙니다. 별도의 스토어 체험판은 제공되지 않습니다.


요약

AI summary
Fixed Range Volume Profile - Manual is a cTrader chart indicator that visualizes tick activity grouped by price within a user-selected time range. It displays a volume profile highlighting the Point of Control (POC)—the price level with the highest tick count—along with the Value Area High (VAH) and Value Area Low (VAL), which define the upper and lower boundaries of the value area containing a configurable percentage of tick observations.

Users add the indicator to a chart and adjust start and end vertical lines to select the analysis period. The profile recalculates dynamically for the chosen range, showing the number of tick observations and key levels in the chart panel. Configuration options include setting the number of price rows (12 to 100) and the value area percentage (50% to 95%), affecting the profile’s resolution and value area size.

The indicator uses tick data representing quote updates at the midpoint between bid and ask prices, not actual traded volume or order flow. It processes up to 100,000 recent ticks depending on broker data availability. This tool provides visual insight into price-level activity but does not generate trade signals or manage orders.

지표 프로필
지표 카테고리
거래량
출력 유형
시각화
데이터 요구 사항
틱 데이터

고객 리뷰

0.0
리뷰: 0
고객 리뷰
이 상품에 대한 리뷰가 아직 없습니다. 이미 사용해 보셨나요? 다른 사람들에게 가장 먼저 소개해 주세요!

상담

자주 묻는 질문(FAQ)

Key Levels
Volume
트레이딩 봇, 지표, 플러그인 등 cTrader Store에서 제공되는 상품은 제3자 개발자에 의해 제공되며, 이는 단순히 정보 및 기술적 접근을 목적으로 제공된 것입니다. cTrader Store는 중개인이 아니며, 투자 조언, 개인별 추천 또는 향후 성과에 대한 어떠한 보장도 제공하지 않습니다.

이 작성자의 상품 더 보기

지표
BOS
MSS
+4
See confirmed BOS, CHOCH and SWEEP structure events on your cTrader chart.
지표
BOS
Add standard-timeframe context candles to a native Renko chart.
지표
EMA
Volume
Map range high, mid, low, price location and a deterministic pressure proxy on your cTrader chart.
지표
Channel
Key Levels
+1
Monitor a selected chart trendline and confirm breaks on candle close.
데스크톱 플러그인
Trade Journal
Trade Statistics
See not only what you made or lost, but which trading behaviours caused the damage.
데스크톱 플러그인
Chart UI Tools
Keep lines, zones and channels synced across selected same-symbol charts from one desktop plugin.
cBot
Drawdown Guard
Daily Loss Limit
Monitor account-wide loss and stop-loss risk budgets, with optional order cancellation and post-fill closure.
데스크톱 플러그인
Position Sizer
Risk Calculator
Size manual trades from your risk settings and review Market, Limit or Stop orders before execution.

좋아하실 만한 다른 항목

지표
Spread Filter
SpreadSync Entry Timer is a compact cTrader indicator that shows live spread and candle-close.
지표
BOS
MSS
+4
See confirmed BOS, CHOCH and SWEEP structure events on your cTrader chart.
지표
Alpha Sentiment Pro - See the Market's Pulse Before It Moves
지표
Forex
BTCUSD
+6
All-In-One solution for ICT's FVG IFVG ORDERBLOCK in advanced mode.
지표
ATR
RSI
+1
Super Trend Rsi ,ATR + trend change distance + dynamic Alpha, divergence/convergence
지표
AI
ATR
+20
Algorithmic trend precision for cTrader.
지표
Forex
Customizable Dynamic Fibonacci Channels and Smart Alerts
지표
EMA
Volume
+4
Advanced volume‑profile tool with delta, HVN/LVN zones, and precise POC‑based trade signals.
지표
Forex
Crypto
+3
Day of Week Indicator for cTrader
지표
AI
ATR
+26
Liquidity Cluster Order automatically detects and draws accumulation zones & distribution zones
지표
Pin Bar
Inducement
+5
Institutional Nasdaq Session Liquidity Map with Live Point HUD, Sweep Alerts & Interactive Playbook.
지표
Prop
Forex
+11
😎Read the description before purchasing💩
지표
Key Levels
Order Block
+5
Order blocks, fair value gaps, liquidity sweeps and a 24-timeframe signal scanner on one chart.
지표
Prop
Forex
+4
A precision-crafted indicator that compares current volume to its historical average for the same time of day.
지표
Prop
Forex
+12
Identify and trade breakouts with Consolidation Zones! Visualize price consolidation areas for trading opportunities.
지표
Forex
Crypto
+2
A powerful cTrader indicator with customizable Moving Average alerts, notifications, and automated trading actions.
지표
Forex
GBPUSD
+3
Support & resistance zones with measured hold rates and confidence intervals — evidence, not just lines on a chart.
지표
Forex
EURUSD
+7
A high‑precision Opening Range indicator that detects session opens (NY, London, EU, Tokyo, Shanghai)

가격

가입일 16/09/2026