SwingHighLowDetector
อินดิเคเตอร์
เวอร์ชัน 2.2, Jan 2026
Windows, Mac
5.0
รีวิว: 3
นี่คือตัวบ่งชี้ความแม่นยำสูงสำหรับการค้นหาสวิง
ผู้ใช้สามารถปรับแต่งตัวบ่งชี้นี้เพื่อส่งการแจ้งเตือนรวมถึงป๊อปอัปบนแผนภูมิและอุปกรณ์อื่นๆ ของตน
วิธีการใช้งาน:
- แนบตัวบ่งชี้กับแผนภูมิ
- มันจะคำนวณสวิงที่ผ่านมาและแสดงบนหน้าจอ
- ปรับแต่งพารามิเตอร์ตามความชอบของคุณเกี่ยวกับบันทึกในอดีตสูงสุดที่ต้องการติดตาม
- เพื่อสร้างการแจ้งเตือน ให้เปิดใช้งานตัวเลือก "Alert Allowed" เพื่อส่งการแจ้งเตือนแบบไดนามิกไปยังอุปกรณ์ของคุณเมื่อมีการก่อตัวและทริกเกอร์สวิงใดๆ
- ฟีเจอร์อีกอย่างหนึ่งที่จะตรวจจับว่าราคาข้ามสวิงหรือไม่ จากนั้นจะลบตัวบ่งชี้นั้นออกจากการวิเคราะห์ (เปิดใช้งานพารามิเตอร์ "Remove Swept levels")
- สุดท้าย ปรับแต่งพารามิเตอร์ "Past Swing Days Alerts" เพื่อรับการแจ้งเตือนสำหรับสวิงทั้งหมดที่เกิดขึ้นในช่วง N วันที่ผ่านมา
ทำไมต้องซื้ออินดิเคเตอร์นี้?
- เพื่อลดการวิเคราะห์สวิงสำหรับตลาดที่แตกต่างกัน
- ด้วยความช่วยเหลือของตัวบ่งชี้ของเรา คุณสามารถมองเห็นสวิงได้อย่างชัดเจนและรับการแจ้งเตือนบนอุปกรณ์ของคุณ ซึ่งจะช่วยประหยัดเวลาของคุณอย่างมาก
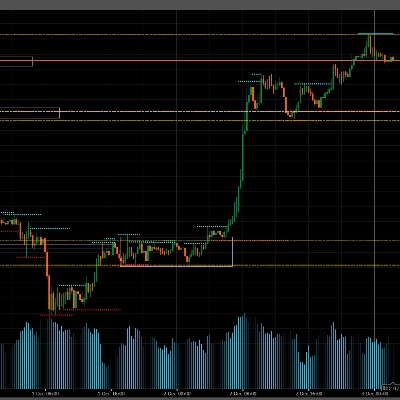
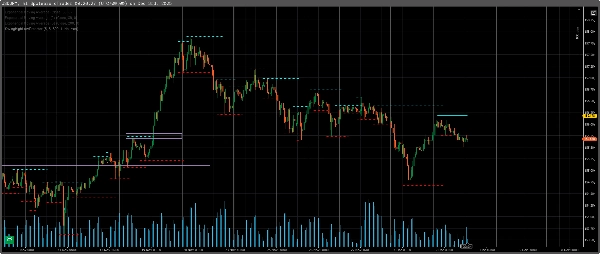
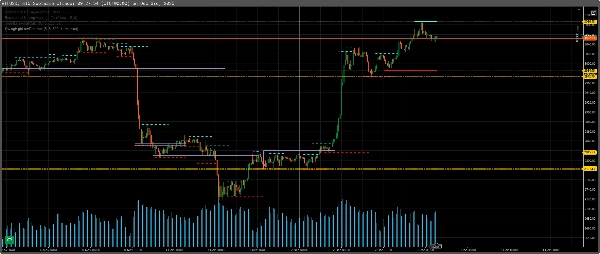
รายละเอียดกราฟิกทั่วไป:
- เส้นประสีน้ำเงินอมเขียวเป็นสวิงสูงในอดีต
- เส้นประสีน้ำเงินทึบเป็นสวิงสูงล่าสุด
- เส้นประสีแดงเป็นสวิงต่ำในอดีต
- เส้นประสีแดงทึบเป็นสวิงต่ำล่าสุด
โปรไฟล์อินดิเคเตอร์
5.0
รีวิว: 3
5 | 100 % | |
4 | 0 % | |
3 | 0 % | |
2 | 0 % | |
1 | 0 % |
รีวิวจากลูกค้า
December 14, 2025
A calm trader gets value from the idea has to earn the click. Overconfidence is the real danger.
December 4, 2025
BTCUSD
Forex
Breakout
Indices
EURUSD
Commodities
GBPUSD
NZDUSD
Prop
Crypto
Stocks
XAUUSD
NAS100
USDJPY
ผลิตภัณฑ์ที่มีให้บริการผ่าน cTrader Store รวมถึงบอทการเทรด อินดิเคเตอร์ และปลั๊กอิน มีให้บริการโดยนักพัฒนาบุคคลที่สามและมีไว้เพื่อวัตถุประสงค์ในการเข้าถึงข้อมูลและทางเทคนิคเท่านั้น cTrader Store ไม่ใช่โบรกเกอร์และไม่ได้ให้คำแนะนำการลงทุน คำแนะนำส่วนบุคคล หรือการรับประกันผลการดำเนินงานในอนาคต


!["[Hamster-Coder] Bollinger Bands" โลโก้](https://cdn.ctrader.com/image/webp/21d8e5d6-fb11-4bac-b9ee-cd05c2b76804_30327)


ตั้งแต่ 13/03/2025