present
ลงทะเบียนและรับส่วนลด $50 สำหรับการซื้อครั้งแรกของคุณ
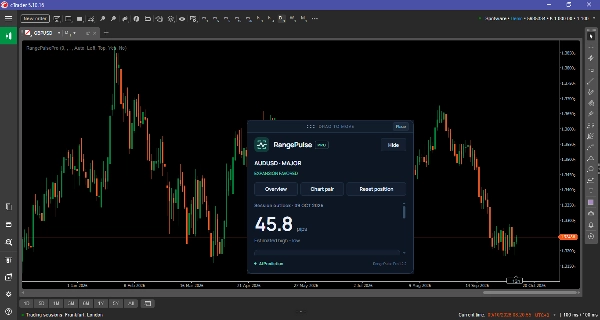
Trading product for RangePulsePro อินดิเคเตอร์ Risk Dashboard, image 1
RangePulsePro
อินดิเคเตอร์
เวอร์ชัน 1.0, Oct 2026
Windows, Mac
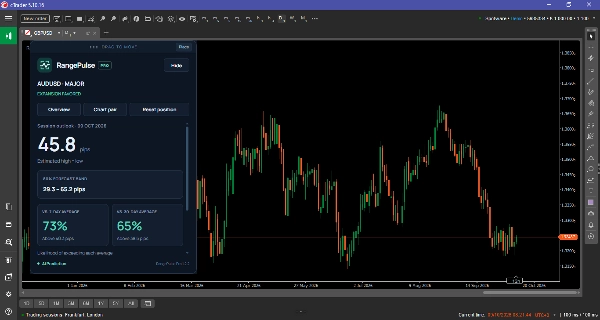
Trading product for RangePulsePro อินดิเคเตอร์ Risk Dashboard, image 2
Trading product for RangePulsePro อินดิเคเตอร์ Risk Dashboard, image 3
Trading product for RangePulsePro อินดิเคเตอร์ Risk Dashboard, image 4
Trading product for RangePulsePro อินดิเคเตอร์ Risk Dashboard, image 5
ตั้งแต่ 13/05/2026

คำอธิบาย

RangePulse Pro — AI Daily Range Forecasts

RangePulse Pro helps traders assess expected daily volatility, compare markets, and plan trades around potential price movement. It analyses 14 supported instruments across major forex pairs, cross pairs, and gold.

How it works

The indicator combines broker H1 candles into daily sessions and uses completed daily data to generate AI forecasts. Inputs include candle structure, moving averages, normalized prices, recent average ranges, and calendar features.

During an active session, the forecast applies to that session. When no session is active, the panel displays a next-session outlook. The session’s realized range updates as prices move.

Understanding the display

  • Estimated range: The predicted high-to-low distance, expressed in pips or price units.
  • 80% forecast band: A lower-to-upper interval for the possible daily range. It represents uncertainty, not guaranteed boundaries or specific high/low price levels.
  • 7-day and 30-day probabilities: The likelihood that the forecast session’s range will exceed each recent average.
  • Expansion Favored: Both probabilities are at least 60%.
  • Quieter Range Favored: Both probabilities are 40% or lower.
  • Balanced Outlook: Other probability combinations.
  • Session progress: The range already realized, shown as a percentage of the estimated range. It can exceed 100%.

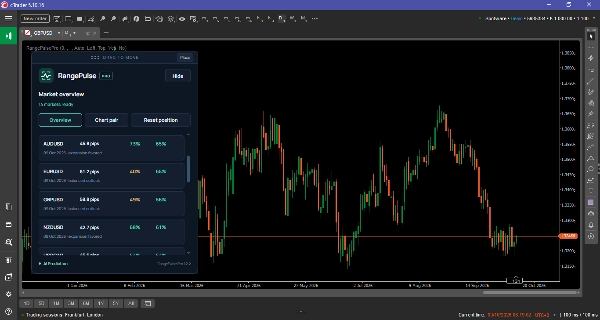
The overview lets you compare instruments and filter by market category. Click a pair to view its forecast details.

Main settings

  • Session UTC offset or timezone: Controls daily candle boundaries. The optional timezone overrides the fixed offset and supports daylight-saving adjustments. These settings should match the training data’s session definition.
  • Broker symbol mappings: Connect supported instruments to broker-specific names, such as XAUUSD=GOLD.
  • Training pair override: Identifies the supported instrument represented by the current chart’s broker alias.
  • Display units: Choose automatic units, pips, or price.
  • Panel settings: Choose initial position, overview or detail mode, and whether to start minimized.

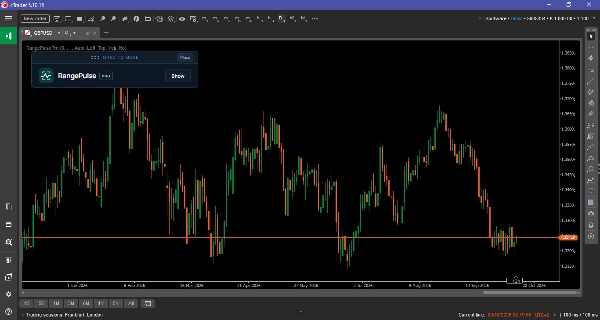
The panel also supports dragging, chart-click placement, and Hide/Show controls.

Typical uses

  • Market selection: Compare instruments to find stronger expansion outlooks before looking for an entry setup.
  • Breakout preparation: Use elevated expansion probabilities to add volatility context to a breakout strategy.
  • Trade planning: Assess whether proposed stop distances and profit targets are reasonable relative to the expected range.
  • Session monitoring: See how much of the estimated range has already occurred before opening another trade.

Who it is for

Designed primarily for intraday traders and traders who plan around daily volatility. Intermediate and experienced traders can integrate it into an existing strategy. Beginners can use the visual dashboard, provided they understand probability, position sizing, and basic risk management.

Important limitations

RangePulse Pro forecasts movement size; it does not predict bullish or bearish direction or provide automatic entry signals. High expansion probability does not guarantee a breakout.

Unexpected news and changing market conditions can produce ranges outside the forecast band. Results also depend on broker history, symbol mapping, and session settings. At least 50 completed daily sessions are required, and unavailable or stale feeds are flagged.

Use the displayed forecast date, combine the outlook with your trading setup, and maintain independent risk controls

สรุป

โปรไฟล์อินดิเคเตอร์

รีวิวจากลูกค้า

0.0
รีวิว: 0
รีวิวจากลูกค้า
ยังไม่มีรีวิวสำหรับผลิตภัณฑ์นี้ หากเคยลองแล้ว ขอเชิญมาเป็นคนแรกที่บอกคนอื่น!

การสนทนา

คำถามที่พบบ่อย

Risk Dashboard
ผลิตภัณฑ์ที่มีให้บริการผ่าน cTrader Store รวมถึงบอทการเทรด อินดิเคเตอร์ และปลั๊กอิน มีให้บริการโดยนักพัฒนาบุคคลที่สามและมีไว้เพื่อวัตถุประสงค์ในการเข้าถึงข้อมูลและทางเทคนิคเท่านั้น cTrader Store ไม่ใช่โบรกเกอร์และไม่ได้ให้คำแนะนำการลงทุน คำแนะนำส่วนบุคคล หรือการรับประกันผลการดำเนินงานในอนาคต

เพิ่มเติมจากผู้เขียนคนนี้

อินดิเคเตอร์
Supply & Demand
Supply Demand Detector: trading indicator identifying zones based on institutional impulsive price moves
อินดิเคเตอร์
BOS
CHOCH
+3
Shows market structure (BoS/CHoCH) and key zones (OB/FVG) to help traders spot high-probability trade setups.

นอกจากนี้คุณยังอาจชอบ

อินดิเคเตอร์
RSI
Stochastic
+2
Composite mean-reversion oscillator merging Z-Score, RSI & Bollinger %B into one clear overbought/oversold signal.
อินดิเคเตอร์
Prop
VWAP
+15
VWAP with standard deviation bands. Fully customizable colors, periods, and multipliers for precise trading signals
อินดิเคเตอร์
Doji
Volume
+5
Instantly spot high-liquidity institutional moves with clean, non-obtrusive triangle alerts on cTrader charts.
อินดิเคเตอร์
AI
MACD
+8
A precision-engineered indicator designed for traders who demand signal integrity across volatile markets.
"QX TradeDecision" โลโก้
เรตติ้งสูง
4.5
(4)
$20
/
$22
อินดิเคเตอร์
ATR
Flag
+5
Decision panel with Buy/Sell scores, market bias, setup quality, trading cost and clear trade reasons.
อินดิเคเตอร์
AI
Forex
+7
Signal Strike is a professional trading indicator delivers clear, high‑confidence entry signals directly on your chart
อินดิเคเตอร์
ATR
Forex
+11
Elliott Wave 2 indicator with Markov probability analysis and a confidence score to assess Wave 3 continuation quality.
"EMA MTF Trend Pro" โลโก้
ยอดนิยม
4.0
(2)
$39
/
$60
อินดิเคเตอร์
AI
RSI
+7
EMA MTF TREND PRO - Multi-timeframe trend analysis overlay indicator, 6 timeframes - in one table with ADX
อินดิเคเตอร์
RSI
RSI on the main chart with 45/55 momentum levels, overbought/oversold levels, averaged RSI, and multi-timeframe support.
"overbought oversold" โลโก้
ยอดนิยม
5.0
(3)
$19
/
$29
อินดิเคเตอร์
AI
ATR
+27
Overbought Oversold Indicator
อินดิเคเตอร์
VWAP
Volume
+5
The MA Quant Volume Profile Custom Range is a trading indicator that analyzes volume distribution across the price.
อินดิเคเตอร์
ATR
Forex
+5
🚀 Buy and sell signals 📈📉 only when three independent engines agree simultaneously.
อินดิเคเตอร์
BOS
MSS
+3
Advanced indicator to highlight key execution context and help aligning structure, location, and risk.
อินดิเคเตอร์
ADX
ATR
+2
GOLD SENTINEL v1.0 - A CANDLE-COLORING INDICATOR FOR GOLD.
"Half Trend Cloud BT" โลโก้
ยอดนิยม
4.5
(2)
$40
/
$80
อินดิเคเตอร์
Prop
Forex
+12
Half Trend Cloud
"LT_Ind_Candles" โลโก้
ยอดนิยม
4.0
(2)
$19
อินดิเคเตอร์
ATR
Forex
+5
Most used candle patterns. (1 candle, 2 candles and 3 candles patterns) and Marubozu. Bonus Fibo Risk control.
อินดิเคเตอร์
ATR
EMA
+4
Range-filter BUY/SELL signals scored by four confluence layers, with a stop, five targets and a trend panel
อินดิเคเตอร์
Prop
Forex
+5
Higher TimeFrame Candle Tracker: Current Timeframe (Any TimeFrame) Show High TimeFrame Candle Bar

ราคา

ตั้งแต่ 13/05/2026