설명
업데이트된 버전 사용 가능 — 여기
이 지표의 업데이트된 버전이 중요한 수정 및 개선 사항과 함께 출시되었습니다:
- 수정된 거래량 분포: 캔들 겹침에 따른 비례 할당 (모든 터치된 레벨에 100% 할당 대신)
- 수정된 VAH/VAL 감지: 허용 오차가 하드코딩된 값 대신 레벨 높이에 따라 조정됨
- 수정된 텍스트 위치 지정: 하드코딩된 일수 대신 동적 시간 프레임 기반 오프셋
- 시간대 오프셋 매개변수: DateTime 프로필용
- 텍스트 위치 매개변수: 룩백 모드에서 좌/우 배치 옵션
- 성능 개선: DateTime 조회를 위한 이진 검색, 캐시된 거래량 계산, 최적화된 딕셔너리 작업
__________________________________________________________________________________________
중요 참고 사항 - 먼저 읽어주세요
외환 거래량은 실제 거래량이 아닙니다
외환에서 거래량은 틱 거래량입니다 — 가격이 변한 횟수를 셉니다. 거래된 금액을 세지 않습니다.
틱 거래량이 보여주지 못하는 것
- 거래 크기. 100달러 거래와 1천만 달러 거래 모두 1틱으로 계산됩니다.
- 실제 자금 흐름. 큰 자금이 움직였는지 작은 자금이 움직였는지 알 수 없습니다.
- 진정한 유동성. 시장에 대기 중인 주문 수를 알 수 없습니다.
- 은행 활동. 은행은 실제 거래량 데이터를 봅니다. 사용자는 볼 수 없습니다.
이것이 의미하는 바
틱 거래량은 가격이 얼마나 자주 변했는지만 보여줍니다 — 그 뒤에 있는 자금은 보여주지 않습니다. 이로 인해 다음과 같은 문제가 발생합니다:
- 은행이나 기관을 추적할 수 없습니다. 그들은 당신이 접근할 수 없는 실제 거래량 데이터를 사용합니다.
- "스마트 머니" 이론을 증명할 수 없습니다. 이러한 아이디어는 틱 수가 아닌 실제 거래량이 필요합니다.
- 진정한 유동성을 판단할 수 없습니다. 틱 활동은 주문 깊이나 실제 시장 강도를 보여주지 않습니다.
- 실제 매수 또는 매도 세력을 측정할 수 없습니다. 많은 작은 거래가 하나의 큰 기관 거래와 동일하게 보입니다.
- 거래량 급증은 거짓일 수 있습니다. 급증은 실제 거래 관심이 아닌 알고리즘 노이즈일 수 있습니다.
이 지표를 올바르게 사용하는 방법
- 금액 측정기가 아닌 활동 측정기로 취급하세요. 높은 틱 거래량 = 시장이 바쁨. 낮은 틱 거래량 = 시장이 조용함. 그 이상은 아닙니다.
- 다른 시간대 간 활동을 비교하세요. 런던 세션이 뉴욕보다 바쁜가? 오늘이 어제보다 더 활동적인가? 추세 기간이 횡보보다 바쁜가?
- 가격 구조와 결합하세요. 지지/저항, 스윙 포인트, BOS/ChoCH와 거래량을 함께 사용하세요. 가격 맥락은 시끄러운 거래량 급증으로 인한 잘못된 신호를 방지합니다.
- 중요 가격 수준에서 활동을 관찰하세요. 가격이 주요 레벨을 테스트하고 틱 거래량이 증가하면 더 많은 거래자가 활동 중임을 의미합니다. 큰 플레이어가 개입했다는 뜻은 아닙니다.
- 기관 활동을 보여준다고 가정하지 마세요. 틱 거래량은 누적, 대량 주문, 또는 "스마트 머니"를 보여줄 수 없습니다. 리듬과 템포를 측정하는 데만 사용하세요.
__________________________________________________________________________________________
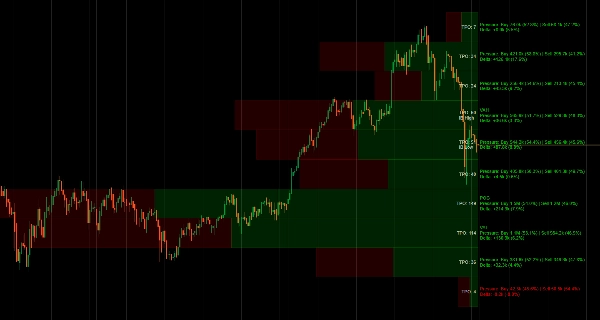
POC, 가치 영역 및 시장 프로필 TPO 추적로 거래량 분포 및 가격별 체류 시간 시각화
이 지표는 시장 프로필 개념을 사용하여 거래량 분포를 보여줍니다. 제어점(가장 높은 틱 활동 레벨), 가치 영역 경계(가장 많은 거래가 발생한 구간), TPO 문자 시퀀스(각 가격에서 체류 시간), 그리고 캔들 방향별 틱 활동을 나누는 델타 시각화를 표시합니다.
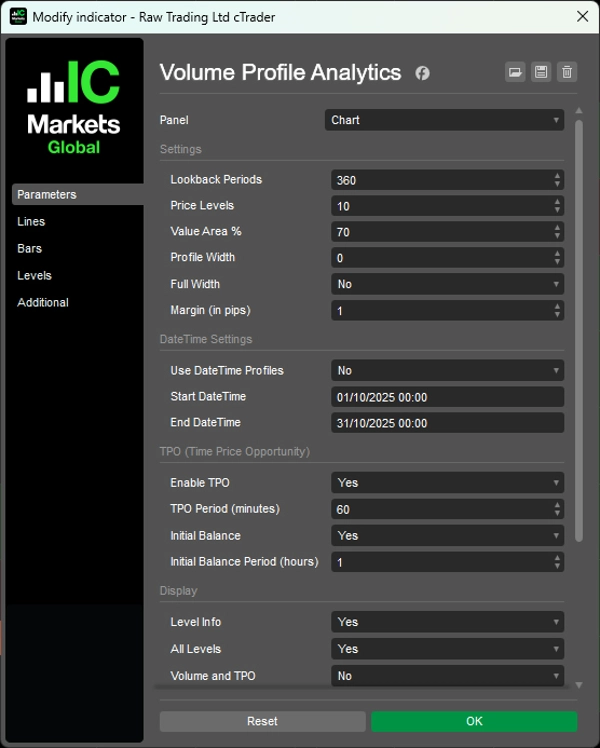
룩백 기간을 선택하거나 특정 날짜 범위를 설정할 수 있으며, 거래량 막대를 비례 또는 전체 너비로 표시하고, 모든 레벨 또는 주요 레벨만 토글하며, 강세/약세 활동에 대한 색상을 사용자 지정할 수 있습니다.
특징
거래량 분포 분석
- 제어점(POC): 가장 활동이 많은 가격 수준 — 가격이 가장 오래 머문 곳
- 가치 영역(VA): 사용자 지정 가능한 활동 집중 구역(기본값 70%) — 가장 많은 거래가 발생한 구간
- VAH/VAL: 가치 영역 상한/하한 경계 — 잠재적 지지/저항 수준
- 델타 시각화: 각 가격 수준에서 캔들 방향을 나누어 표시
시장 프로필 TPO
- 시간-가격 기회 추적: 각 가격에서 거래된 시간 기간 수 계산
- TPO 문자: 가격에서 체류 시간을 시각적으로 표현 (A-Z 순서)
- 초기 균형(IB): 첫 한 시간 범위 — 일간 거래 구조에 중요
- IB 상/하 표시기: 개장 범위 극한
유연한 룩백 옵션
- 기간 기반: 분석할 바 수 설정 (예: 최근 120개 바)
- DateTime 범위: 특정 날짜/시간 사이에 프로필 고정하여 이벤트 분석
- 동적 너비: 자동 조정 또는 고정 너비 프로필
표시 옵션
- 거래량 막대: 비례 너비(활동에 따라 조정) 또는 전체 너비 균일 막대
- 각 막대 내 캔들 방향 분할
- 백분율 포함 델타 계산
- 모든 레벨 또는 주요 레벨만 토글 (POC, VAH, VAL)
- 거래량/TPO 세부 정보 표시 제어
- 백분율로 방향별 분류
- 조정 가능한 글꼴 크기 및 핍 기반 여백
색상 사용자 지정
- 강세/약세 방향 막대에 대한 독립 색상
- 양수/음수 델타에 대한 별도 텍스트 색상
- TPO 전용 텍스트 색상
성능 최적화
- 캐시된 시간 조회 및 효율적인 사각형 그리기
- 부드러운 성능을 위한 최소 재계산
- 캔들 구조 기반 전문 등급 델타 계산
__________________________________________________________________________________________
더 많은 무료 지표
구조와 거래량부터 회귀, 변동성, 맞춤 시간 프레임에 이르기까지 다양한 시장 분석 도구를 탐색하세요.
소스 코드는 GitHub 저장소에서 확인할 수 있습니다.
모두 무료로 사용할 수 있습니다. 하지만 커피 지원을 보내고 싶다면 여기로 보내실 수 있습니다.
지지/저항
거래량
이동 평균
유틸리티/맞춤형
회귀 기반
변동성
오실레이터
__________________________________________________________________________________________
면책 조항
거래에는 위험이 따릅니다. 이 지표는 기술적 분석용으로만 의도되었으며 — 항상 적절한 위험 관리를 적용하고 책임감 있게 거래하세요.
피드백 및 개선 사항
제안, 기능 요청 또는 개선 아이디어가 있으면 토론 탭에 댓글을 남겨주세요. 여러분의 피드백은 모두를 위한 지표 개선에 도움이 됩니다.
요약
Users can customize lookback periods by number of bars or specific date/time ranges and choose between proportional or full-width volume bars. The indicator also provides delta visualization, splitting tick activity by candle direction with percentage breakdowns, and offers extensive display and color customization options for bullish and bearish activity.
This tool is optimized for performance with cached calculations and efficient drawing methods. It is designed to measure market activity rhythm and tempo based on tick volume, which counts price changes but does not represent actual traded money or liquidity. It is suitable for analyzing volume distribution and market structure across various trading sessions and timeframes.
고객 리뷰
5 | 100 % | |
4 | 0 % | |
3 | 0 % | |
2 | 0 % | |
1 | 0 % |