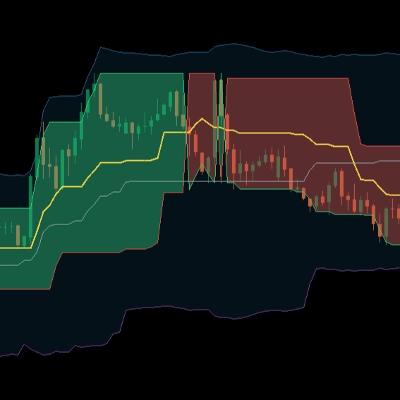
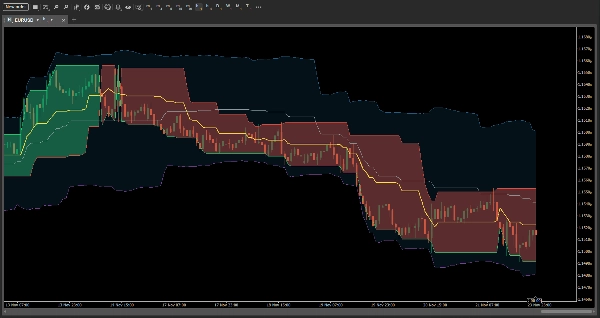
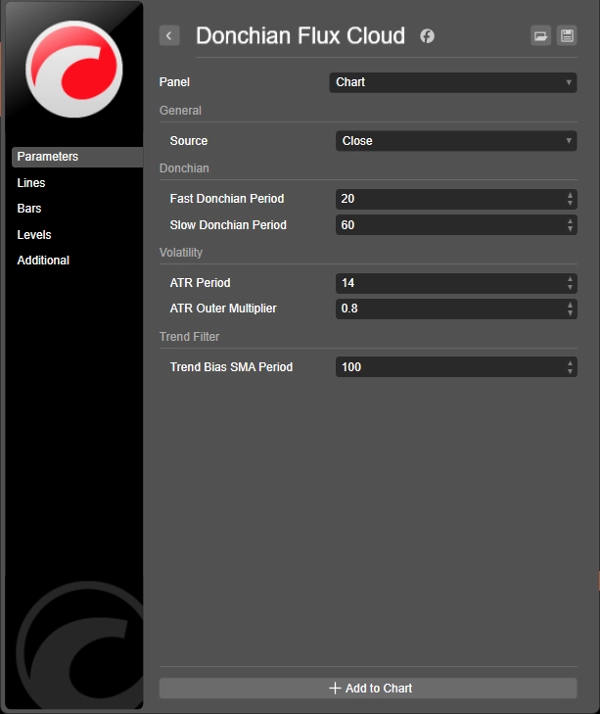
중개인 및 프랍
비즈니스용
00
Days
:
00
Hours
:
00
Minutes
:
00
Seconds
Donchian Flux Cloud
5.0
23/11/2025
78
Desktop
가입일 22/11/2025
무료 설치
78
"Donchian Flux Cloud" 업로드된 이미지"Donchian Flux Cloud" 업로드된 이미지

Donchian Flux Cloud is a trend and volatility visualizer built from two Donchian channels (fast & slow) plus an ATR-based outer envelope.

The inner cloud tracks the fast Donchian range and flips color with the prevailing trend, while the outer band expands and contracts with ATR to show when price is breaking out into higher-volatility territory. It’s designed to highlight squeezes, breakouts, and regime shifts at a glance without cluttering the chart.


____________

Provided by - strategytune backtesting app

5.0
리뷰: 1
5
100 %
4
0 %
3
0 %
2
0 %
1
0 %
고객 리뷰
November 29, 2025
좋아하실 만한 다른 항목
지표
ATR
Fibonacci
Scalping
+1
Auto Fibonacci With Golden Levels
Auto Fibonacci Retracement Pro – Smart Swing & Golden Zone Levels
IR CheckList
you could put your check list in your chart you could split your test with “,” you could put your checklist in indicat
지표
NAS100
Indices
Prop
+6
VolumeThermometer
Heatmap of intra-HTF volume (POC/VA) built from LTF tick data; paints current candle and auto-loads visible history.
지표
Grid
NAS100
RSI
+19
Delta-RSI Candle Pro
Delta RSI Candle Pro
지표
RSI
Indices
StochasticRSI
Stochastic RSI (StochRSI) is a technical indicator used to measure the strength and weakness of the RSI.
지표
RSI
MACD
Multi-Timeframe Market Levels
Unlock market insights with our Multi-Timeframe Market Levels indicator, enhancing your trading strategies effortlessly
Big Candel
1 Candel High Time Freme
지표
Forex
VegaXLR - cTrader Multi-Timeframe Pivot Pro
Customizable multi-timeframe pivot point indicator for cTrader with alerts, Fibonacci, CPR, and more!
Daily Open Pivot Level
This indicator is a valuable tool for traders looking to identify significant opening price level of any asset.
지표
RSI
Signal
MACD
[Stellar Strategies] Moving Averages Combined 1.0
Smooths price action with 6 MAs (3 SMA, 3 EMA). Reduces noise, clarifies trends 📈📉
지표
Indices
Stocks
Forex
+1
TwoSMA.cs
An indicator that accurately shows the trend direction. A vital tool for clear trading decisions.
Vishal Volume Profile v2.0
Volume Profile plots traded volume at each price level, highlighting high activity zones of precise support & resistance
지표
Stocks
Forex
Crypto
PinBarCandlestickPattern
PinBarCandlestickPattern Indicator
지표
Indices
RSI
Stocks
+5
REDGREENZONEREVERSAL
The Red & Green Zone Reversal Indicator detects overbought and oversold market conditions using Bollinger Bands and RSI.
지표
Indices
Prop
Stocks
+3
Market Sessions Advanced
Advanced Market Sessions with ICT killzones
지표
Forex
EURUSD
USDJPY
4 Currencies V2_NSC
Relative Currency Strength 4 Currencies: AUD USD EUR JPY
지표
Breakout
VegaXLR - Fixed Range Volume Profile
Identify key support and resistance levels through detailed volume distribution analysis.
지표
NAS100
NZDUSD
Indices
+7
Hull Moving Average Colored
The traditional Hull Moving Average with different colours based on the slope (direction) of the trend.