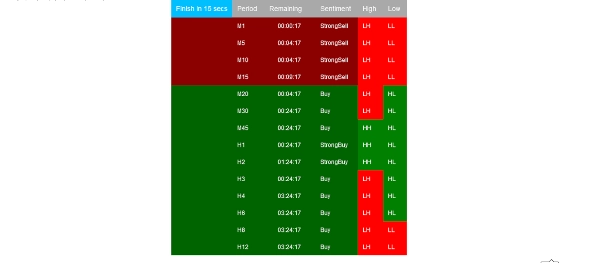
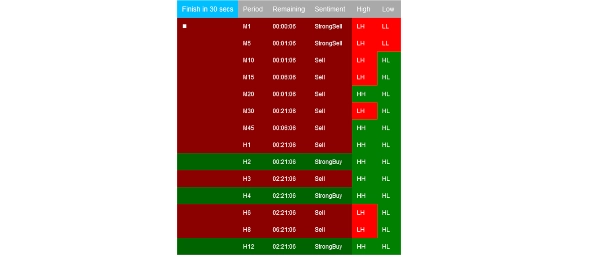
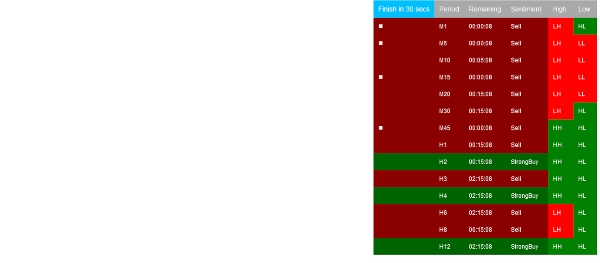
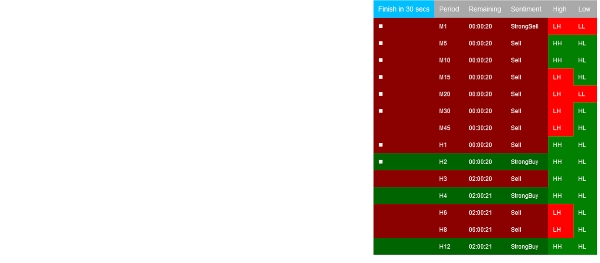
BarSentiments
"BarSentiments" 로고
5.0
03/09/2025
235
Desktop
가입일 19/04/2025
거래량
284.2M
핍 수익
1.07M
판매
7
무료 설치
1431
"BarSentiments" 업로드된 이미지"BarSentiments" 업로드된 이미지"BarSentiments" 업로드된 이미지"BarSentiments" 업로드된 이미지

This Bar Sentiments Chart Indicator is a technical analysis tool that measures the strength and direction of market sentiment on a bar-by-bar (or candlestick-by-candlestick) basis. It examines the relationship between each bar’s open, high, low, and close prices to determine whether the market exhibited bullish, bearish, or neutral behavior during that time period.

Typically, a bullish sentiment is identified when the close price finishes significantly higher than the open, indicating strong buying pressure. A bearish sentiment is detected when the close is notably lower than the open, signaling strong selling pressure. Neutral bars, often called "dojis," reflect indecision or balance between buyers and sellers.

Advanced versions of the Bar Sentiments Indicator may incorporate additional elements such as volume, relative body size, or momentum to refine the sentiment classification. Sentiments are often visualized through color-coding—green for bullish, red for bearish, and gray or blue for neutral—making it easy to quickly assess the prevailing market tone.

If 1s and 0s are the building blocks of software engineering, then the output of the Bar Sentiments Chart Indicator represents the fundamental building blocks of advanced machine learning trading systems. By quantifying raw market sentiment, it provides essential inputs for algorithms that seek to learn and predict future price movements based on historical behavior.

Using the Bar Sentiments Chart Indicator, traders gain a deeper understanding of micro market dynamics, helping them identify trend strength, potential reversals, and consolidation periods—especially when combined with multi-timeframe analysis and other technical tools.

5.0
리뷰: 2
5
100 %
4
0 %
3
0 %
2
0 %
1
0 %
고객 리뷰
August 18, 2025
Pros: Simple and effective bar sentiment visualization. Lightweight and works on all timeframes. Useful for scalping and intraday trading. Cons: No alerts, MTF mode, or preset saving. Limited integration with other tools.
July 8, 2025
Great Tool Nardo. It would be great to have this same graphic visualisation in a cTrader plugin, in orden to free chart space and having the table on the side (right column of the platform, under the New Order section)
이 작성자의 상품 더 보기
최고 평점
무료
FairValueGap
This Fair Value Gap (FVG) indicator is a technical analysis tool used to identify potential price imbalances.
지표
Signal
FairValueGap-PremiumVersion1
This Fair Value Gap (FVG) indicator is a technical analysis on multi-timeframe.
지표
Indices
Stocks
Forex
+2
HorizontalSupportResistance
This extraordinary multi-timeframe support and resistance indicator is nothing short of market wizardry.
좋아하실 만한 다른 항목
MultiTimeFrame Moving Averages
3 moving averages with different periods and different time frames.
지표
RSI
Breakout
XAUUSD
+6
Fair Value Gap Sessions
identify and highlight temporary market inefficiencies known as "fair value gaps" 🚨 within specific trading Sessions.
SupertrendHTF
Overlay higher-timeframe SuperTrend to filter noise, follow real trends, and avoid lower-timeframe whipsaws. As
지표
Indices
ATR
Forex
+1
[Stellar Strategies] Market Regime Filter
Filters market regimes (trend/range/pullback) using MAs, ADX, ATR/BBW Vol, opt. Volume. Helps adapt strategy. 📉📈
지표
Forex
SpreadCalculator - BossFXTrader
Spread Calculator to calculate the difference between two prices or values.
지표
Grid
RSI
XAUUSD
+12
Trend Pulse X
is a trend-following indicator designed to provide a clear view of market direction, momentum, and strength
지표
Signal
Trend Bars Color
New Trend whit buy-sell signal
Candle Timer & Strength Demo
Candle Timer & Strength DEMO for cTrader This is a DEMO version of the Candle Timer & Strength indicator. You can use al
지표
RSI
Breakout
XAUUSD
+5
Zones Supply Demand
📊Zones Supply & Demand: Identifies key price levels with high volume concentration, marking Supply/Demand Zones & Marke
지표
EURUSD
Compare Symbol
Plots chosen symbol's close price, candlestick (wick, body) on cTrader chart, supports multiple timeframes.
JMA-Like
JMA-like is a highly responsive and ultra-smooth moving average designed to replicate the behavior of the original JMA!
지표
NAS100
NZDUSD
Martingale
+26
Support & Resistance Pro
The Support & Resistance Pro helps traders identify key support and resistance levels for informed trading decisions.
Renko 4k Pips
Custom your Renko Brick how do you wish!
지표
RSI
Breakout
Supertrend
+1
Dynamic Trend Gradient
Identifies trends with moving averages & volatility. Base levels = bullish 🐂 or bearish 🐻 signals. Reversals detected!
지표
Breakout
VIX - volatility indicator - Renko
Volatility indicator for Renko.
지표
Indices
RSI
Commodities
+1
OrderPrice-V3
A straightforward yet effective tool signals entry points for both buying and selling. Include 3 Moving Average
지표
Indices
RSI
XAUUSD
+8
RSI Trend Trigger
RSI Trend Trigger 📈: Uses dual-layer RSI to spot trends & generate clear buy/sell signals.