present
Registrieren Sie sich und erhalten Sie $50 Rabatt auf Ihren ersten Kauf
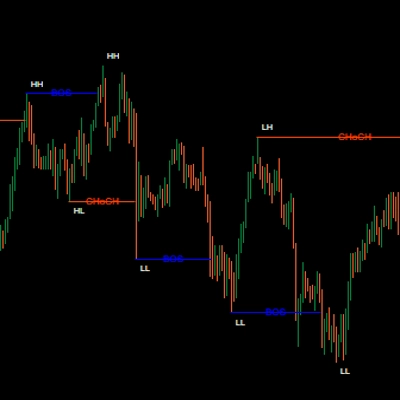
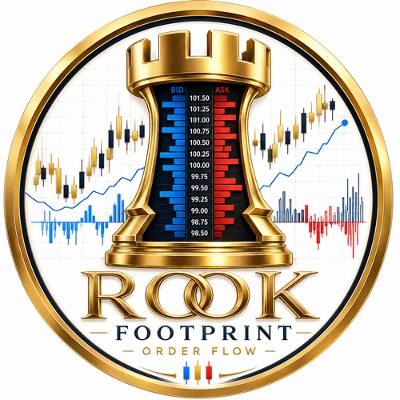
Trading product for Rook - Footprint_Orderflow Indikator Key Levels Imbalance, image 1
Rook - Footprint_Orderflow
Indikator
4 käufe
Version 2.0, Aug 2026
Windows, Mac
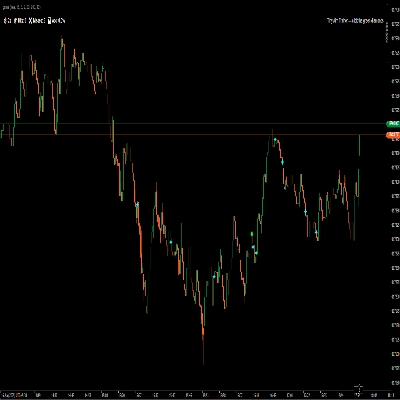
Trading product for Rook - Footprint_Orderflow Indikator Key Levels Imbalance, image 2
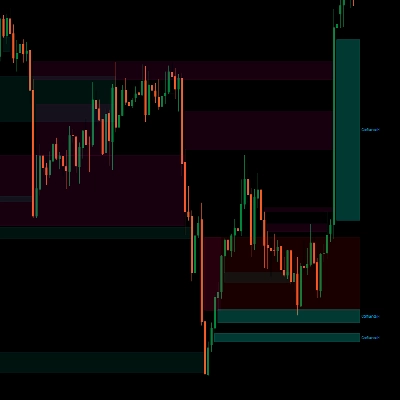
Trading product for Rook - Footprint_Orderflow Indikator Key Levels Imbalance, image 3
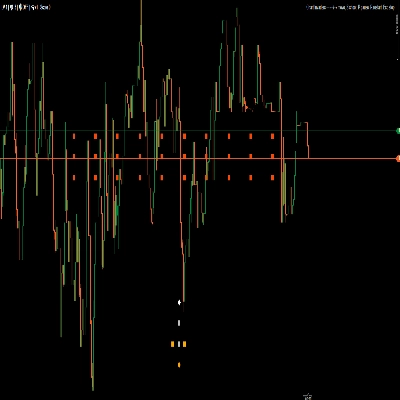
Trading product for Rook - Footprint_Orderflow Indikator Key Levels Imbalance, image 4
Trading product for Rook - Footprint_Orderflow Indikator Key Levels Imbalance, image 5
94
Verkäufe
168
Kostenlose Installationen

Beschreibung

Warum Rook Footprint?

Egal, ob Sie Ausbrüche bestätigen, potenzielle Umkehrungen identifizieren, die Marktteilnahme überwachen oder die Liquidität analysieren, Rook Footprint bietet professionelle Orderflow-Tools in einem schnellen, sauberen und intuitiven Paket.

Entwickelt für Trader, die tiefere Markteinblicke ohne unnötige Komplexität wünschen.

Funktionen

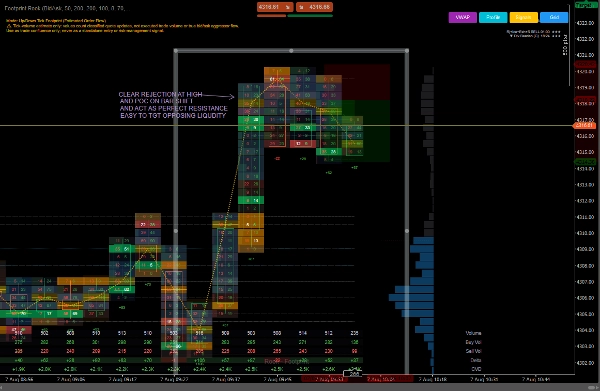
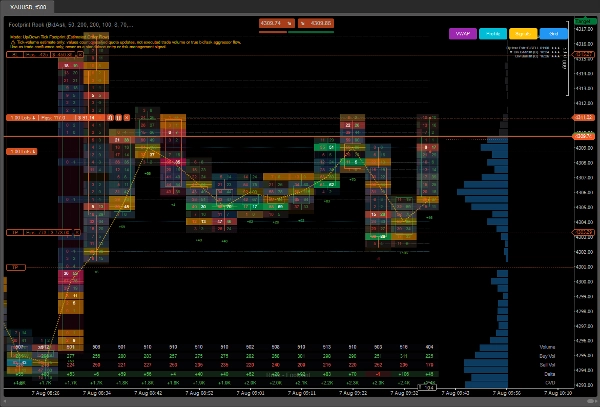
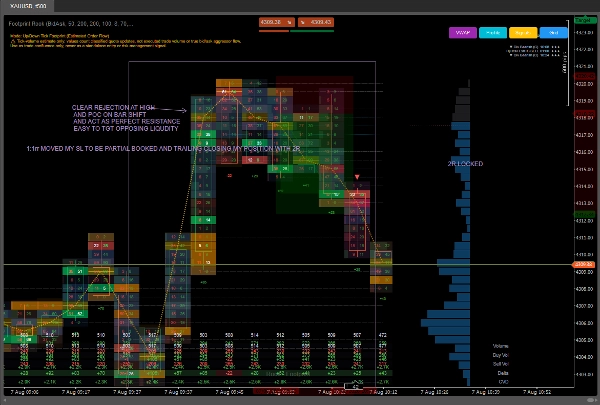
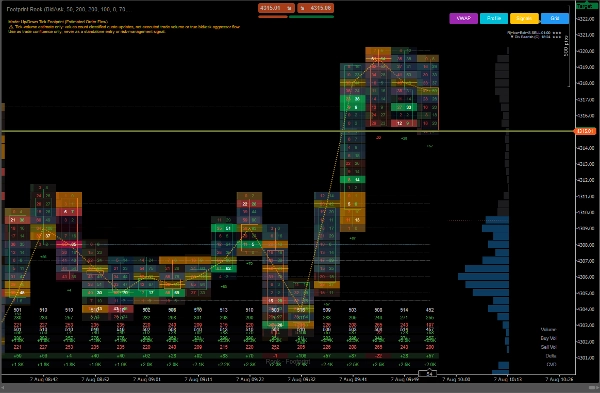
Visualisieren Sie Kauf- und Verkaufsaktivitäten auf jeder gehandelten Preisstufe mit einer klaren Footprint-Anzeige und intelligenter Heatmap-Visualisierung.

  • Erkennt automatisch verfügbare Broker-Daten.
  • Verwendet Bid Ask wenn unterstützt.
  • Fällt automatisch in den Up Down Tick Modus zurück, wenn Bid/Ask-Daten nicht verfügbar sind.

Orderflow-Analyse

  • Ungleichgewichtserkennung
  • Gestapelte Ungleichgewichtsbereiche
  • Absorptions-Erkennung
  • Erschöpfungserkennung
  • Delta-Analyse

Entwickelt, um wichtige Bereiche von Kauf- und Verkaufsaktivitäten mit klarer visueller Darstellung zu identifizieren.

Statistik-Panel

Überwachen Sie wesentliche Marktstatistiken für jede Footprint-Bar, einschließlich:

  • Gesamtvolumen
  • Kaufvolumen
  • Verkaufsvolumen
  • Delta
  • Kumulatives Delta (CVD)

Alle Statistiken werden in einem sauberen, leicht lesbaren Layout direkt unter dem Chart dargestellt.

Entwickelt für Klarheit & Performance-Fokus

Rook Footprint legt Wert auf Lesbarkeit ohne unnötige Unordnung.

  • Professionelle Heatmap-Visualisierung
  • Leicht lesbare Statistiken
  • Anpassbare Farben und Erscheinungsbild

Alles ist darauf ausgelegt, Ihnen zu helfen, den Orderflow schnell zu interpretieren und gleichzeitig Ihre Charts sauber und fokussiert zu halten.

Funktioniert mit:

  • Forex
  • Futures
  • Indizes
  • Rohstoffe
  • Krypto

Unterstützt alle Chart-Zeitrahmen und passt sich automatisch an die vom Broker verfügbaren Marktdaten an.

Für das beste Erlebnis:

  • Verwenden Sie Broker, die hochwertige Tick-Daten bereitstellen.
  • Erhöhen Sie die "Ticks" bei hochvolatilen Instrumenten, wenn Sie eine sauberere Anzeige bevorzugen.
  • Reduzieren Sie die Anzahl der "sichtbaren Balken zur Anzeige" auf leistungsschwächeren Computern.
  • Kombinieren Sie die Footprint-Analyse mit Ihrer bestehenden Handelsstrategie, anstatt sie als eigenständiges Signal zu verwenden.

Anforderungen

  • C trader Desktop (Windows oder macOS)
  • Keine externen Datenfeeds erforderlich
  • Verwendet die integrierten Marktdaten von C Trader
  • Zugriffsrechte: Keine

Kategorie: Volumen / Orderflow

Tags: footprint, order flow, bid ask, up/down tick, delta, kumulatives delta, Volumenanalyse, Ungleichgewicht, Absorption, Erschöpfung, Liquidität, Unterstützung Widerstand,

Wichtiger Datenschutzhinweis Rook - Footprint verwendet klassifizierte Broker-Bid/Ask-Quote-Updates, um Up/Down Tick-Druck zu schätzen. Es liefert keine verifizierten ausgeführten Handelsvolumen, echtes Bid-at/Ask-at Aggressor-Volumen oder zentrales FX-Markvolumen. Verwenden Sie alle Footprint-Lesungen und Signale nur als Handelskonfluenz, niemals als eigenständiges Ein-, Ausstiegs- oder Risikomanagementsystem.

Haftungsausschluss :

Der Handel mit Finanzmärkten birgt erhebliche Risiken, und vergangene Leistungen garantieren keine zukünftigen Ergebnisse.


Orderflow-Informationen stammen aus den Marktdaten, die Ihr Broker über C Trader bereitstellt. Wenn echte Bid/Ask-Daten verfügbar sind, verwendet der Indikator diese automatisch für Footprint-Berechnungen. Andernfalls verwendet er die Up/Down Tick-Schätzung. Datenqualität und verfügbare Funktionen können zwischen Brokern und Instrumenten variieren. Dieser Indikator ist ein Analysewerkzeug und bietet keine Finanz-, Anlage- oder Handelsberatung.


Zusammenfassung

KI-Zusammenfassung
Rook - Footprint_Orderflow is a professional order flow footprint indicator designed for use on the cTrader Desktop platform (Windows or macOS). It visualizes buying and selling activity at each traded price level through a clean footprint display combined with an intelligent heatmap. The indicator automatically detects available broker data, using true Bid/Ask data when supported, and falls back to Up/Down Tick mode otherwise.

Key order flow analysis features include imbalance detection, stacked imbalance zones, absorption and exhaustion detection, and delta analysis. A statistics panel beneath the chart presents total volume, buy and sell volume, delta, and cumulative delta (CVD) in an easy-to-read format.

Rook Footprint supports all chart timeframes and adapts automatically to the market data provided by the broker. It is compatible with multiple markets including Forex, Futures, Indices, Commodities, and Crypto. The indicator emphasizes clarity and performance with customizable colors and a clutter-free layout to facilitate quick interpretation of order flow.

No external data feeds or special access rights are required, as it uses cTrader’s built-in market data. It is intended as an analytical tool to complement existing trading strategies.
Indikatorprofil
Indikatorkategorie
Orderfluss/DoM
Ausgabetyp
Visualisierung
Filter
Datenanforderungen
Tick-Daten
Volumen
DoM
Nur Balken
Unterstützte Signale
Level – Berührung
Wendepunkt
Ausbruch
Abweichung
Trendstärke
Volatilität
Level – Durchbrechen

Diskussion

Kundenbewertungen

0.0
Bewertungen: 0
Kundenbewertungen
Bisher gibt es keine Bewertungen für dieses Produkt. Haben Sie es schon ausprobiert? Dann können Sie die erste Person sein, die andere darüber informiert!

Häufig gestellte Fragen (FAQ)

Key Levels
Imbalance
Volume
Market Structure
Supply & Demand
Liquidity Grab
Support & Resistance
Über den cTrader Store verfügbare Produkte, einschließlich Handelsbots, Indikatoren und Plugins, werden von externen Entwicklern bereitgestellt und nur zu Informations- und technischen Zugriffszwecken verfügbar gemacht. cTrader Store ist kein Broker und erbringt keine Anlageberatung, persönlichen Empfehlungen oder eine Garantie für zukünftige Performance.

Mehr von diesem Autor

Indikator
Doji
Transform Your Charts Instantly with 20+ Professionally Designed Themes
Indikator
BOS
CHOCH
+5
MarketStructurePro – Smart BOS/CHoCH
Indikator
trading stress-relief “mini-game”
Indikator
Forex
Indices
+1
Professional Fair Value Gaps with multitimeframe spot on
Indikator
trading stress-relief “mini-game”
Indikator
Forex
Indices
+5
Market Profile TPO for cTrader — full auction logic, IB, POC, VA zones, histogram and O/X markers with time
Indikator
SMC
VWAP
+4
Killzone Session and key levels with VWAP – Precision Meets Price Action
Indikator
Forex
BTCUSD
+5
Buy-Side & Sell-Side Liquidity (BSL/SSL) Indicator
Indikator
SMC
Prop
+12
Multi-TF FVG + Smart Fibonacci
Indikator
SMC
Prop
+16
Multi-Time Frame Candlesticks FVG with BSL/SSL Premium Suite
Indikator
Market Sessions
Indikator
SMC
Prop
+13
Perfect for traders who demand a clear overview of multiple timeframes at a glance.

Das könnte Sie auch noch interessieren

Indikator
SMC
Forex
+5
📊 Detects Fair Value Gaps with lower timeframe volume analysis & clean dashboard 🟢🔴
Indikator
VWAP
Volume
+5
The MA Quant Volume Profile Custom Range is a trading indicator that analyzes volume distribution across the price.
Indikator
AI
ATR
+27
The "Market Temperature" Moving Average -Turn Your MA Into a Live Market Temperature Line
Indikator
SMC
Prop
+12
SMC Pro Suite: OBs, FVGs, Structure, Liquidity, Killzones & MTF overlay. Every concept in one cTrader indicator.
Indikator
RSI
VWAP
+5
Turtle Soup ICT Strategy – Detect liquidity traps & trade smart money moves with precision on cTrader.
Indikator
RSI
VWAP
+5
Trend direction, chart signals, reversal zones and volume tools in one configurable indicator.
Indikator
Breakout
Open Range Breakout by SLA is a fully customizable multi-session indicator designed for structured intraday traders.
Indikator
AI
RSI
+7
Multi-asset screener with real-time RSI/volatility analysis, interactive dashboard, and color-coded trading signals.
Indikator
SMC
VWAP
+5
Most advanced Volume Profile Pivot Box indicator — auto pivots, volume zones, smart candle coloring & SMC trading tool.
Indikator
Fibonacci
Key Levels
+1
Explore Elliott wave counts, three swing sizes and example levels with an interactive cTrader chart panel.
Indikator
VWAP
Volume
+4
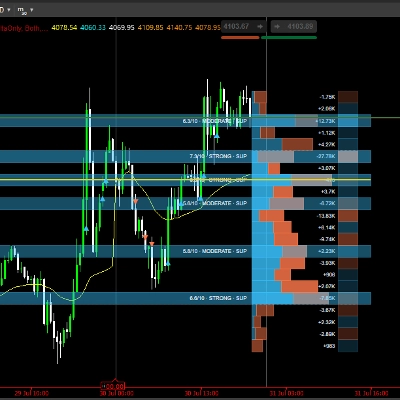
Advanced Order Flow & Volume Profiling for cTrader. Unveil institutional footprints, Delta, and Anchored VWAPs.
Indikator
Fair Value Gap
Liquidity Grab
+2
PRO Liquidity Sweep + FVG Combo detector with custom Gold/Blue signals & alerts
Indikator
Key Levels
Trend-filtered signals, transparent trade plans and a multi-timeframe decision panel for cTrader.
„wt.Z-Trend“-Logo
Beste Ratings
4.5
(4)
Ab $9
Indikator
Forex
Crypto
+5
This indicator combines two independent analytical engines into a single overlay on your chart.
Indikator
Doji
Wedge
+5
Angora Pattern Recognition is a cTrader indicator that finds, draws and tracks classic chart patterns automatically.
Indikator
ATR
Prop
+5
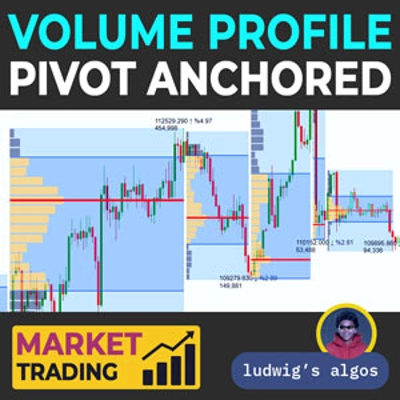
Anchor volume profiles to pivots with POC, VAH, VAL and real-time insights for clearer trade decisions.
Indikator
VWAP
Volume
+4
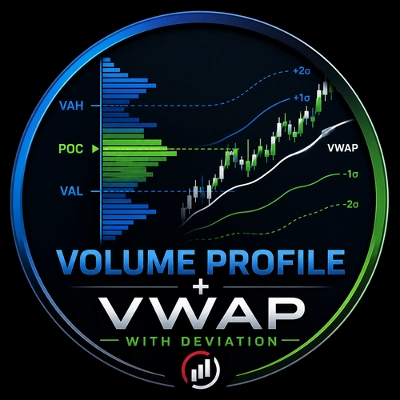
Volume Profile + VWAP with Standard Deviations
Indikator
Volume
Fibonacci
+3
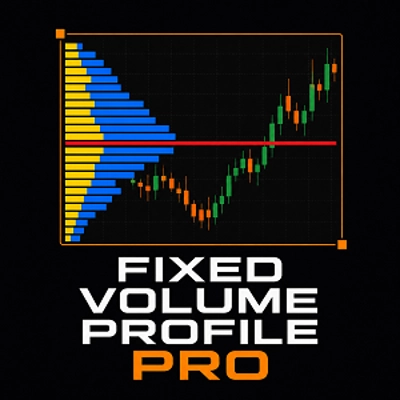
Draw and manage multiple fixed-range volume profiles with persistent levels, developing POC/VA and smart alerts.

Preis

94
Verkäufe
168
Kostenlose Installationen