
RsiMultiFrameOBOS
Indicator
Version 1.0, Oct 2025
Windows, Mac
4.0
Reviews: 1
Description
Description:
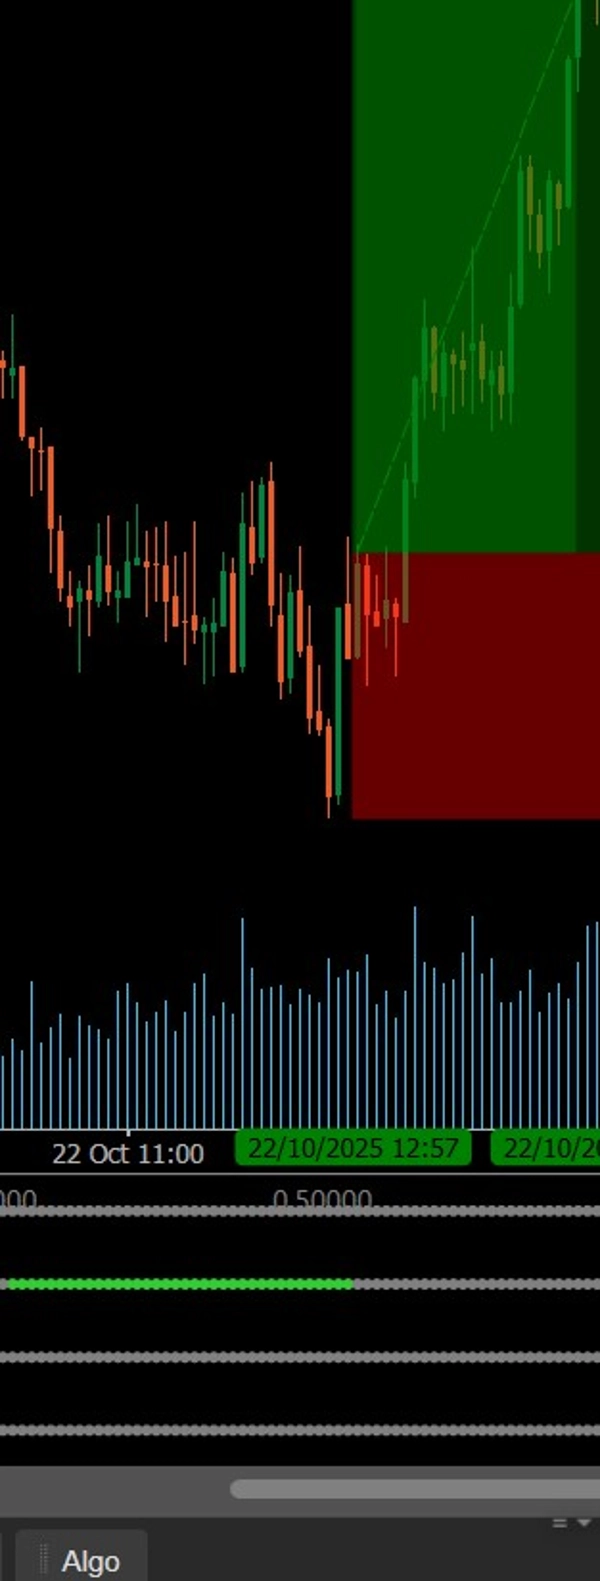
This indicator visualizes RSI trends across four customizable timeframes using color-coded dots (green for oversold, red for overbought, gray for neutral). It helps traders instantly assess market momentum alignment and identify multi-timeframe RSI confirmations for stronger entries.
Summary
AI summary
RsiMultiFrameOBOS is an indicator that displays Relative Strength Index (RSI) trends across four customizable timeframes using color-coded dots: green for oversold, red for overbought, and gray for neutral conditions. This visualization enables traders to quickly assess momentum alignment and identify multi-timeframe RSI confirmations, supporting stronger trade entry decisions. The indicator is applicable across various markets including Forex, cryptocurrencies, stocks, commodities, and indices, and supports symbols such as BTCUSD, EURUSD, and XAUUSD. It is suitable for trading strategies like scalping and can assist in analyzing market momentum in multiple timeframes simultaneously.
Indicator profile
Customer reviews
4.0
Reviews: 1
5 | 0 % | |
4 | 100 % | |
3 | 0 % | |
2 | 0 % | |
1 | 0 % |
Customer reviews
November 8, 2025
A few signals across sessions tell more, and the review screen feels calmer.
Discussion
FAQ
BTCUSD
Prop
Forex
Scalping
Indices
EURUSD
Commodities
RSI
Crypto
Stocks
XAUUSD
Martingale
Products available through cTrader Store, including trading bots, indicators and plugins, are provided by third-party developers and made available for informational and technical access purposes only. cTrader Store is not a broker and does not provide investment advice, personal recommendations or any guarantee of future performance.
More from this author


Price
Since 21/01/2025
3
Sales