
Descrição
Supertrend Channels é um indicador de sobreposição personalizado projetado para ajudar os traders a identificar visualmente zonas dinâmicas de suporte e resistência, sinais de entrada e níveis de stop-loss móvel usando lógica baseada em ATR.
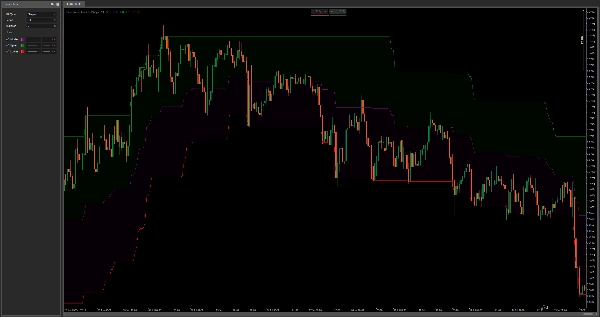
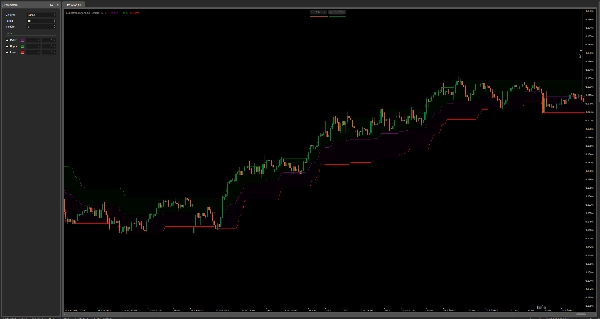
O indicador traça três linhas:
- Faixa Superior (Verde) – atua como uma resistência dinâmica ou stop-loss móvel para operações longas.
- Faixa Inferior (Vermelha) – atua como suporte dinâmico ou stop-loss móvel para operações curtas.
- Linha do Meio (Roxa) – serve como nível de reversão à média ou ponto potencial de entrada.
Ele calcula as faixas usando o Average True Range (ATR) multiplicado por um fator definido pelo usuário (Multiplier) e adiciona/subtrai isso da máxima/mínima da vela atual. Um método de suavização (tipo de MA selecionável) é aplicado ao ATR para ajustar a responsividade.
Como Usar:
- Entrada: Procure entradas próximas à linha do meio durante consolidações ou após sinais de cruzamento.
- Stop-Loss Móvel: Use faixas superior/inferior como zonas dinâmicas de saída para garantir lucro conforme as tendências se estendem.
- Suporte & Resistência: Essas faixas atuam como zonas adaptativas que refletem a volatilidade recente e ajudam a identificar potenciais pontos de reversão.
Ao contrário das Bandas de Bollinger padrão, esta abordagem ancora as faixas nos extremos de preço mais a volatilidade, não em uma média móvel, tornando-a mais responsiva em ambientes de tendência e mais adaptável para trading discricionário ou algorítmico.
Resumo
Avaliações de clientes
5 | 50 % | |
4 | 50 % | |
3 | 0 % | |
2 | 0 % | |
1 | 0 % |


