
الوصف
السيطرة على تقلبات السوق بدون ازدحام المخططات
أداة Squeeze Momentum Candle Painter هي مؤشر متقدم للتقلب والزخم يعتمد على منطق TTM Squeeze الكلاسيكي. بدلاً من ملء شاشتك بالمذبذبات، يقوم هذا الأداة بتلوين أشرطة السعر بذكاء، مما يتيح لك التعرف على حركات انفجارية ذات احتمالية عالية وتحولات الاتجاه مع الحفاظ على نظافة ومهنية المخطط الرئيسي الخاص بك.
نظرة عامة
ينتقل السوق بين حالتين: الضغط (الانضغاط) و التمدد (التقلب). يستخدم هذا المؤشر العلاقة بين نطاقات بولينجر وقنوات كيلتنر لتحديد هذه المراحل، مع دمج خوارزمية زخم الانحدار الخطي لتحديد اتجاه وقوة الاتجاه.
الميزات الرئيسية
-
- ترميز لوني بديهي: تعرف فوراً على زخم الاتجاه من خلال 4 ألوان شموع مميزة.
- خوارزمية TTM Squeeze: حساب مدمج لانضغاط السعر وانحدار الزخم.
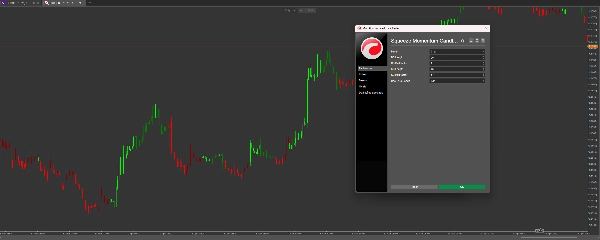
- تصميم واجهة نظيف: يلغي الحاجة إلى نافذة مخطط بياني منفصلة، مما يمنحك مساحة أكبر لتحليل حركة السعر.
- قابلية تخصيص كاملة: ضبط معلمات نطاق بولينجر وقناة كيلتنر لتناسب أي إطار زمني أو فئة أصول (فوركس، مؤشرات، أو العملات الرقمية).
- منطق بدون تأخير: يستخدم الانحدار الخطي لاكتشاف تحولات الزخم أسرع من المتوسطات المتحركة التقليدية.
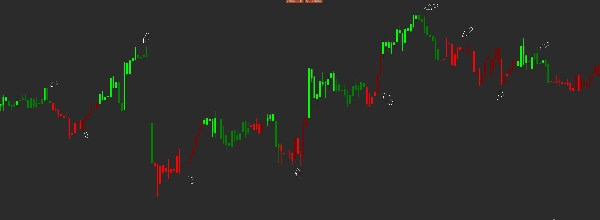
كيفية قراءة الألوان :
-
- الليموني » زخم صعودي قوي (في ازدياد)
- الأخضر » تراجع الزخم الصعودي (تباطؤ)
- الأحمر » زخم هبوطي قوي (في ازدياد)
- الكستنائي » تراجع الزخم الهبوطي (تباطؤ)
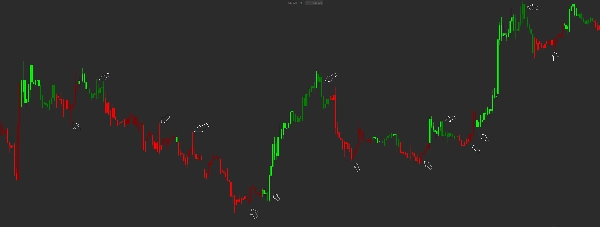
استراتيجية التداول
التراكم: عندما يكون الزخم منخفضاً (كستنائي أو أخضر)، غالباً ما يكون السوق "يضغط" أو يتماسك.
الاختراق: ابحث عن انتقال من الأخضر إلى الليموني (صعودي) أو من الكستنائي إلى الأحمر (هبوطي). هذا يشير إلى تسارع الزخم.
الخروج: عندما تتحول شمعة ليمونية إلى خضراء، أو شمعة حمراء إلى كستنائية، فهذا يشير إلى أن الحركة الحالية تفقد زخمها—وقت مثالي لجني الأرباح أو تشديد وقف الخسارة.
لماذا تختار هذا المؤشر؟
يفشل معظم المتداولين لأنهم يتفاعلون متأخرين جداً. يقوم Squeeze Momentum Candle Painter بتصور "الطاقة الداخلية" للسوق. من خلال مراقبة تغير ألوان الشموع، تحصل على ميزة نفسية، تبقى في الصفقات الرابحة لفترة أطول وتخرج قبل حدوث الانعكاس.
الملخص
تقييمات العملاء
5 | 100 % | |
4 | 0 % | |
3 | 0 % | |
2 | 0 % | |
1 | 0 % |


![شعار "[Stellar Strategies] Inside Bar with Signals"](https://cdn.ctrader.com/image/webp/1d9e8bfa-3b2c-4440-bb37-5856902008a7_30683)


