
설명
기관 지원 및 저항 시각화 도구
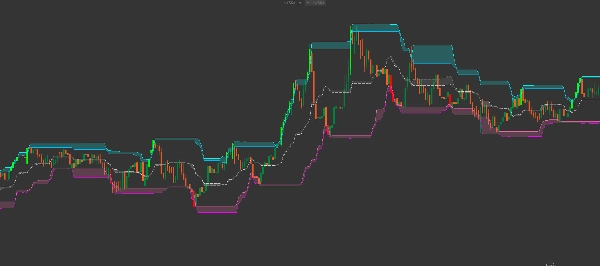
이 스마트 돈치안 클라우드 리버설 은 고확률 반전 구역을 식별하기 위해 설계된 차세대 변동성 채널입니다. 최고점과 최저점만 추적하는 일반 돈치안 채널과 달리, 이 지표는 캔들 심지 와 캔들 몸통 간의 관계를 분석하여 "압력 구름"을 그립니다.
이 구름들은 공급과 수요의 동적 구역으로 작용하여 시장이 멈추거나 반전할 가능성이 있는 지점을 정확히 보여줍니다.
고급 다중 구름 아키텍처
이 지표는 정교한 3층 구름 시스템을 특징으로 합니다:
-
- 저항 구름 (시안/파랑): 상단에 위치하며, 최고 심지와 최고 캔들 몸통 사이의 간격을 시각화합니다. 이것이 "매도 구역"입니다.
- 균형 구름 (회색/은색): 시장의 균형을 추적하는 중앙 리본입니다. 심지와 몸통 사이의 공정 가치 중간점을 나타냅니다.
- 지지 구름 (분홍/마젠타): 하단에 위치하며, 최저 심지와 최저 캔들 몸통 사이의 간격을 시각화합니다. 이것이 "매수 구역"입니다.
주요 거래 기능
-
- ATR 변동성 필터: 내장된 ATR(평균 실제 범위) 승수를 포함하여 외부 밴드를 약간 보정하여 시장 소음과 "스톱 헌트"를 필터링합니다.
- 스마트 캔들 페인팅: 지표가 자동으로 돌파 모멘텀을 강조 표시합니다:
- 라임 캔들: 가격이 상단 저항 구름 위에서 마감되었습니다 (강세 돌파).
- 빨간 캔들: 가격이 하단 지지 구름 아래에서 마감되었습니다 (약세 돌파).
- 심지 대 몸통 논리: "구름" 두께를 보면 변동성을 가늠할 수 있습니다. 두꺼운 구름은 긴 심지(높은 거부/우유부단)를 의미하고, 얇은 구름은 강하고 결정적인 가격 움직임을 의미합니다.
스마트 돈치안 클라우드로 거래하는 방법
1. 평균 회귀 (스캘핑) » 가격이 저항 구름 에 진입하지만 그 위에서 마감하지 않는 것을 찾으세요. 이는 종종 "가짜 돌파"를 나타내며, 중간선 쪽으로의 고확률 숏 진입 신호입니다.
2. 추세 돌파 » 캔들이 라임 (상단 심지 필터 위에서 마감)으로 변할 때, 이는 강세가 저항 구역을 돌파했음을 신호합니다. 이는 추세 추종 전략에 강력한 신호입니다.
3. 지지 반등 » 지지 구름 (분홍색)을 주시하세요. 상승 추세에서 되돌림 시 가격이 이 구역에 닿으면, 기관 매수자가 자주 개입하는 "가치 매수" 구역을 나타냅니다.
기술적 매개변수
-
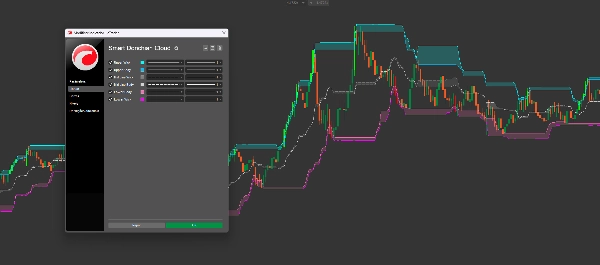
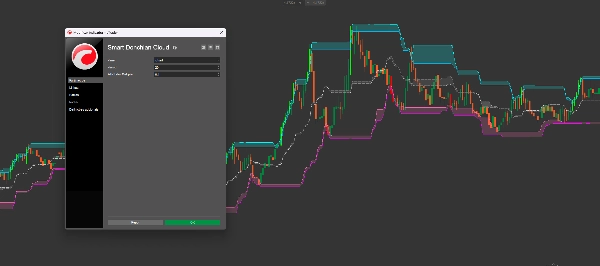
- 기간: 최고점과 최저점을 계산하는 조회 기간 (기본값: 20).
- ATR 필터 승수: 극단값 주변의 "패딩"을 조정하여 작은 급등에 걸리지 않도록 합니다.
- 완전 맞춤형 색상: 상단, 중간, 하단 구름을 개인 차트 템플릿에 맞게 조정할 수 있습니다.
이 도구가 필수적인 이유
대부분의 트레이더는 지지와 저항을 단일 선으로 취급하기 때문에 실패합니다. 실제로는 구역 입니다. 스마트 돈치안 클라우드 리버설 은 이러한 구역을 수학적으로 매핑하여 전통적인 채널 지표보다 더 명확한 시장 구조를 제공합니다.
요약
고객 리뷰
5 | 100 % | |
4 | 0 % | |
3 | 0 % | |
2 | 0 % | |
1 | 0 % |


