
说明
结构热区
参与强度图
--------------------------------------------------
查看价格争夺的位置。查看价格忽略的位置。
大多数支撑/阻力工具绘制的是价格曾经出现的位置的线条。
结构热区回答:市场是否真正关心这个水平?
--------------------------------------------------
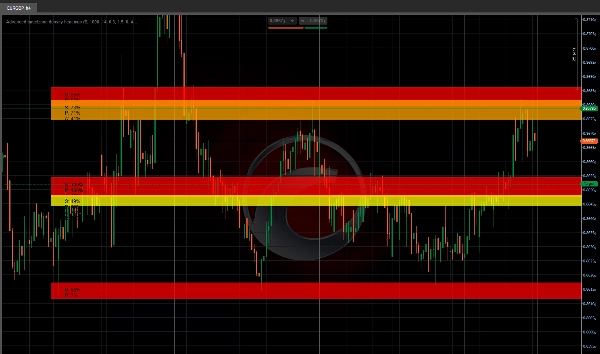
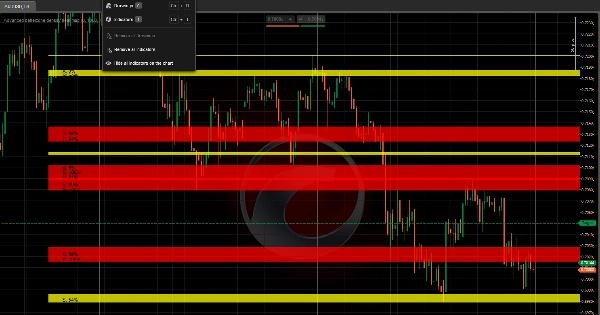
热度强度评分(0 到 100)
指标分析波动聚集并分配热度评分:
- 红色区域(热度80到100)= 最强的结构参与
- 橙色区域(热度60到80)= 活跃的结构区
- 黄色区域(热度40到60)= 中等兴趣
- 蓝色区域(热度低于40)= 弱结构
热度越高 = 越多波动聚集 = 市场关注度越高。
--------------------------------------------------
接受与拒绝追踪
对于每个结构热区,指标追踪价格行为:
- 接受 = 价格收盘于区域内(支撑行为)
- 拒绝 = 价格在区域留下长影线(阻力行为)
这告诉你该区域是否可能保持或反转。
--------------------------------------------------
市场参与度分析
系统测量:
- 蜡烛触及次数(价格访问每个区域的频率)
- 区域内收盘次数(接受率)
- 影线拒绝次数(拒绝率)
- 可配置的回溯周期
低参与度 = 弱区域。高参与度 = 结构热区。
--------------------------------------------------
视觉强度映射
- 按热度评分颜色编码区域(红色=最热)
- 拒绝可视化的光晕扩展
- 显示数据标签:热度 / 参与度 / 接受率 / 拒绝率评分
- 自动清理(区域自动重绘)
- 可选的波峰/波谷箭头
--------------------------------------------------
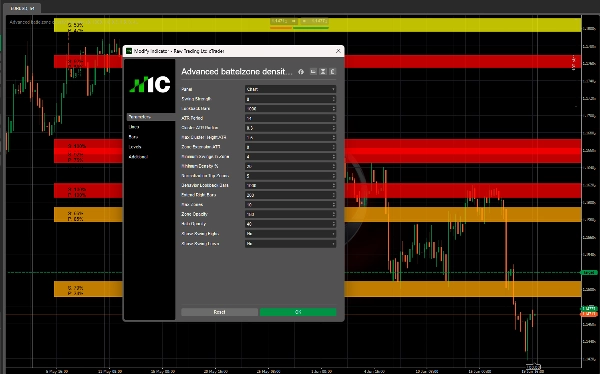
关键参数
- 波动强度:枢轴灵敏度(越高=波动越少)
- 回溯条数:检测波动的回溯范围
- ATR周期:用于自适应半径计算
- 聚类ATR半径:波动聚集的距离要求
- 最大聚类高度ATR:拒绝宽于此的区域
- 区域扩展ATR:拒绝检测的光晕大小
- 区域内最小波动数:最小聚类大小
- 最小热度评分:仅显示高于此的区域
- 行为回溯条数:参与度追踪周期
- 最大区域数:显示的最大区域数
- 区域/光晕不透明度:视觉透明度
--------------------------------------------------
使用案例
- 寻找真正的结构热区(高热度+高参与度)
- 区分接受区和拒绝区
- 避免低热度、低参与度区域
- 识别结构聚类以便进出场布局
- 与趋势指标或订单流的汇合
--------------------------------------------------
技术说明
- 叠加指标(绘制在价格图表上)
- 适用于任何时间框架和品种
- 通过ATR自动适应波动性
- 无重绘(波动为历史数据)
--------------------------------------------------
来自INVICTUS EA的制造者
结构热区采用了Invictus自动交易系统中相同的结构参与技术。
--------------------------------------------------
风险披露
该指标是一个分析工具。它不生成自动交易信号。所有交易决策均由用户自行负责。
--------------------------------------------------
支持
包含终身更新。
欲了解更多信息 - 点击下方开发者资料。
摘要
Key features include color-coded heat zones, halo extensions for rejection visualization, and data labels displaying heat, participation, acceptance, and rejection scores. The system measures candle touches, closes inside zones, and wick rejections over a configurable lookback period to quantify market engagement. Adjustable parameters allow customization of swing sensitivity, cluster radius, zone size, and visual opacity.
This tool supports any timeframe and symbol, adapts to volatility using ATR, and does not repaint historical swings. It is intended for identifying genuine structural heat zones, differentiating acceptance from rejection areas, and aiding entry and exit placement in conjunction with other trend or order flow indicators. The indicator is analytical and does not generate automated trading signals.
客户评价
5 | 100 % | |
4 | 0 % | |
3 | 0 % | |
2 | 0 % | |
1 | 0 % |


