
Описание
ДЕТЕКТОР СВИНГОВ
Структурные точки свинга + коррекция Фибоначчи + RSI
--------------------------------------------------
БЕСПЛАТНЫЙ ИНДИКАТОР
Определяйте структурные свинги. Видьте тренд. Торгуйте с подтверждением.
--------------------------------------------------
ЧТО ДЕЛАЕТ ЭТОТ ИНДИКАТОР
Swing Detector определяет структурные максимумы и минимумы свингов, используя обнаружение локальных экстремумов с настраиваемой глубиной и фильтрацией по автодевиации.
Затем он соединяет свинги трендовыми линиями, накладывает стандартные уровни коррекции Фибоначчи и отображает текущее значение RSI рядом с ценой.
--------------------------------------------------
КЛЮЧЕВЫЕ ОСОБЕННОСТИ
- Обнаружение точек свинга (настраиваемая глубина)
- АВТО-ДЕВИАЦИЯ: фильтрация на основе ATR адаптируется к любому таймфрейму
- Режим фиксированной девиации в пипсах (для ручного управления)
- Трендовые линии свинга (восходящий синий, нисходящий оранжевый)
- КОРРЕКЦИЯ ФИБОНАЧЧИ (0, 23.6, 38.2, 50, 61.8, 78.6, 100 процентов)
- НАЛОЖЕНИЕ ЗНАЧЕНИЯ RSI (текущий RSI рядом с ценой)
- Настраиваемые цвета
- Оптимизация производительности (максимальное количество баров для отрисовки)
--------------------------------------------------
АВТО-ДЕВИАЦИЯ - КЛЮЧЕВАЯ ОСОБЕННОСТЬ
Доступны два режима девиации:
- ФИКСИРОВАННЫЕ ПИПСЫ: установите фиксированное минимальное расстояние в пипсах между свингами
- НА ОСНОВЕ ATR (АВТО): динамическая девиация на основе текущей волатильности
ПОЧЕМУ АВТО-ДЕВИАЦИЯ ВАЖНА:
- M1 до M5: узкая девиация (ловит мелкие свинги)
- H1 до H4: средняя девиация (ловит структуру)
- D1 до MN1: широкая девиация (ловит крупные свинги)
Индикатор автоматически адаптируется к используемому таймфрейму. Нет необходимости в ручной настройке при переключении графиков.
Это делает Swing Detector применимым на ВСЕХ таймфреймах — от минутных до месячных графиков.
--------------------------------------------------
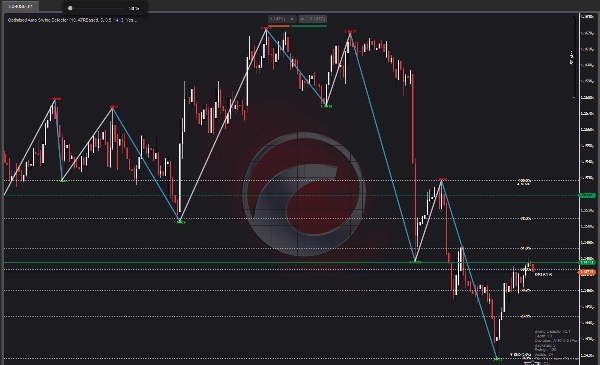
КОРРЕКЦИЯ ФИБОНАЧЧИ - КЛЮЧЕВАЯ ОСОБЕННОСТЬ
Для последнего завершённого свинга индикатор рисует:
- 0.0 процентов (начало свинга)
- 23.6 процентов
- 38.2 процентов
- 50.0 процентов
- 61.8 процентов
- 78.6 процентов
- 100.0 процентов (конец свинга)
Включайте и выключайте линии и подписи. Все уровни цветовые для быстрого визуального восприятия.
--------------------------------------------------
НАЛОЖЕНИЕ RSI - КЛЮЧЕВАЯ ОСОБЕННОСТЬ
Текущее значение RSI отображается рядом с ценой с цветовой кодировкой:
- КРАСНЫЙ: RSI выше 70 (перекупленность)
- ЗЕЛЁНЫЙ: RSI ниже 30 (перепроданность)
- БЕЛЫЙ: RSI между 30 и 70 (нейтрально)
Это обеспечивает мгновенный контекст импульса без открытия отдельного окна RSI.
--------------------------------------------------
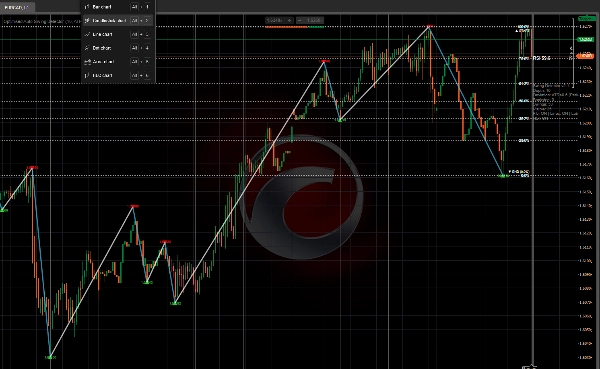
ВИЗУАЛЬНЫЕ ЭЛЕМЕНТЫ
- Красные стрелки вниз = максимумы свинга
- Зелёные стрелки вверх = минимумы свинга
- Синие линии = восходящий свинг (от минимума к максимуму)
- Оранжевые линии = нисходящий свинг (от максимума к минимуму)
- Золотые горизонтальные линии = уровни Фибоначчи
- Белые подписи = проценты Фибоначчи
- Значение RSI = текущий RSI рядом с ценой
- Информационная панель = глубина, девиация, обратный шаг, количество свингов
--------------------------------------------------
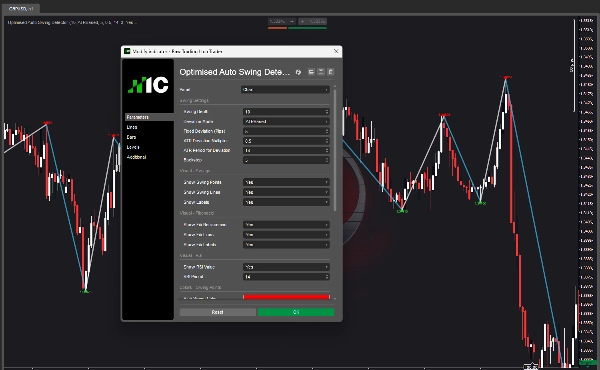
ОБЗОР ПАРАМЕТРОВ
НАСТРОЙКИ СВИНГА:
- Глубина свинга: сколько баров проверять для локальных экстремумов
- Режим девиации: фиксированные пипсы или на основе ATR (авто)
- Фиксированная девиация: минимальное расстояние в пипсах между свингами
- Множитель девиации ATR: множитель для девиации на основе ATR
- Период ATR: период для расчёта ATR
- Обратный шаг: минимальное количество баров между свингами
ВИЗУАЛЬНОЕ - СВИНГИ:
- Показать точки свинга: переключение стрелок
- Показать линии свинга: переключение трендовых линий
- Показать подписи: переключение ценовых подписей
ВИЗУАЛЬНОЕ - ФИБОНАЧЧИ:
- Показать коррекцию Фибоначчи: переключение наложения Фибоначчи
- Показать линии Фибоначчи: переключение горизонтальных линий
- Показать подписи Фибоначчи: переключение процентных подписей
ВИЗУАЛЬНОЕ - RSI:
- Показать значение RSI: переключение наложения RSI
- Период RSI: период для расчёта RSI
ЦВЕТА:
- Цвет максимума свинга
- Цвет минимума свинга
- Цвет линии восходящего свинга
- Цвет линии нисходящего свинга
- Цвет линии Фибоначчи
- Цвет текста Фибоначчи
- Цвет подписи RSI
ПРОИЗВОДИТЕЛЬНОСТЬ:
- Максимальное количество баров для отрисовки: ограничивает отрисовку для повышения производительности
--------------------------------------------------
СЛУЧАИ ИСПОЛЬЗОВАНИЯ
- Определение структурных точек свинга на ЛЮБОМ таймфрейме
- Рисование трендовых линий между свингами
- Использование уровней Фибоначчи для входов, выходов и целей по прибыли
- Подтверждение сделок с помощью совпадения RSI
- Понимание структуры рынка с первого взгляда
- Переключение таймфреймов без настройки параметров (Авто-девиация)
--------------------------------------------------
ПРИМЕНЕНИЕ НА ТАЙМФРЕЙМАХ
С включённой АВТО-ДЕВИАЦИЕЙ индикатор работает на:
- M1, M5, M15 (скальпинг)
- M30, H1, H4 (дейтрейдинг)
- D1 (свинг-трейдинг)
- W1, MN1 (позиционная торговля)
Один индикатор. Все таймфреймы.
--------------------------------------------------
ПОВЫШЕНИЕ ДО STRUCTURAL HEAT ZONES
Этот бесплатный индикатор показывает вам свинги и структуру.
Structural Heat Zones идут дальше — они отображают интенсивность участия, принятие против отторжения и вовлечённость рынка в нескольких зонах.
Ищите Structural Heat Zones в магазине cTrader.
--------------------------------------------------
ПОВЫШЕНИЕ ДО INVICTUS EA
Invictus EA использует ту же структурную технологию для выполнения автоматических сделок.
Ищите Invictus в магазине cTrader.
--------------------------------------------------
ТЕХНИЧЕСКИЕ ЗАМЕТКИ
- Индикатор накладывается поверх графика
- Работает на любом таймфрейме и символе
- Без перерисовки (свинги исторические)
- Оптимизирован для производительности
--------------------------------------------------
ПОДДЕРЖКА
Включены обновления на всю жизнь.
ДЛЯ ПОЛУЧЕНИЯ ДОПОЛНИТЕЛЬНОЙ ИНФОРМАЦИИ — нажмите на профиль разработчика ниже.
Сводка
Отзывы покупателей
5 | 100 % | |
4 | 0 % | |
3 | 0 % | |
2 | 0 % | |
1 | 0 % |


