
Описание
Введение в ADX
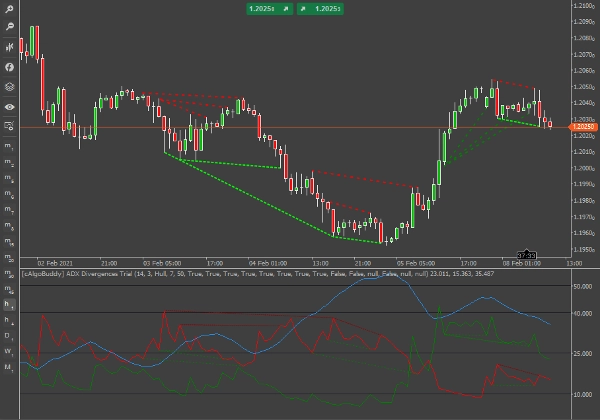
ADX (синяя линия) отображается в виде одной линии со значениями от нуля до ста. ADX является недирекциональным; он фиксирует силу тренда независимо от того, растет цена или падает. Индикатор обычно отображается в том же окне, что и две линии индикатора направленного движения (Di+ и Di-), на основе которых вычисляется ADX.
Этот индикатор выявляет дивергенции на линиях Di+ и Di-. В отличие от других индикаторов, которые обнаруживают дивергенции, с этим мы можем получить более ценную информацию из двух других составляющих сигнала дивергенции. Например, если дивергенция происходит на Di+, мы можем оценить сигнал, учитывая уровни Di- и ADX.
Линии Di+ и Di- частично сглажены с помощью скользящей средней Халла за 3 периода. Для 100% режима поиска дивергенций можно установить период MA равным 1 и тип скользящей средней — Простая. Однако, поскольку мы рисуем дивергенции на двух линиях в одном окне индикатора, иногда сигналы могут казаться избыточными. С другой стороны, в настройках индикатора можно выбрать, какие именно типы дивергенций и для какой линии (Di+ или Di-) вы хотите видеть.
Сигнал дивергенции считается подтвержденным при открытии бара, следующего за дивергенцией. Однако из-за «жесткой» природы линий тренда ADX (в сравнении, например, с RSI) как только появляется линия дивергенции, она, вероятно, останется до бара подтверждения, если не произойдет экстремальная волатильность.
Перед торговлей по любому сигналу дивергенции определите следующее:
- Направление и уровень ADX
- Расстояние между Di+ и Di-
- Направление и уровень Di+
- Направление и уровень Di-
Также имейте в виду
- Избегайте торговли по дивергенциям, когда ADX низок (ниже 15 и падающий тренд), так как сигналы следует принимать на основе уже сформировавшихся или формирующихся трендов.
- Также учитывайте, что пересечение Di+ и Di- само по себе считается бычьим/медвежьим сигналом, поэтому корректируйте свои позиции соответственно.
- Если дивергенция происходит одновременно на Di+ и Di-, выбирайте более подходящую линию в зависимости от тренда (бычий тренд/бычий сигнал — Di+, медвежий тренд/медвежий сигнал — Di-).
- Не обязательно торговать по каждому сигналу.
Дивергенции на DiPlus
DiPlus (зеленая) — линия, отображающая силу бычьего тренда. Мы можем обнаруживать дивергенции между силой бычьего тренда аналогично большинству осцилляторов.
Обычная бычья дивергенция
Определение: Цена сделала более низкий минимум, а индикатор — более высокий минимум. Идеальный результат: после небольшого бычьего подъема должен развиться медвежий тренд. Отмечается пунктирной светло-зеленой линией в окнах цены и индикатора.
Доминирующий медвежий тренд, который начинает развиваться или уже сформирован. Мы открываем короткую позицию после небольшой коррекции. В некоторых случаях дивергенция на Di+ может возникать на медвежьей свече, что является хорошим подтверждением доминирующего медвежьего тренда.
Иногда бычий подъем приведет к развитию бычьего тренда. Это может происходить при отсутствии или слабом тренде (Di+ и Di- близки друг к другу, ADX< 20) или после истощения медвежьего тренда на уровнях сопротивления.
Скрытая бычья дивергенция
Определение: Цена сделала более высокий минимум, а индикатор — более низкий минимум. Следует ожидать развития или продолжения бычьего тренда. Отмечается частично пунктирной темно-зеленой линией в окнах цены и индикатора.
Доминирующий бычий тренд, который начинает развиваться или уже сформирован. Мы открываем длинную позицию после небольшой коррекции. Стоп-лосс следует разместить около минимума свечи дивергенции.
Один из лучших сигналов этого индикатора, главным образом потому, что ожидается немедленное продолжение тренда, и мы можем минимизировать стоп-лоссы.
Обычная медвежья дивергенция
Определение: Цена сделала более высокий максимум, а индикатор — более низкий максимум. После небольшого медвежьего спада должен развиться бычий тренд. Отмечается пунктирной темно-красной линией в окнах цены и индикатора.
Доминирующий бычий тренд все еще растет (ADX продолжает расти во время дивергенции).
Обстоятельства для такого сценария очень редки, поскольку Di+ отражает силу быков. Обычно это происходит после истощения бычьего тренда, что означает, что это последний «пик» перед началом развития медвежьего тренда. Поэтому чаще всего рекомендуется открывать короткие позиции по этому сигналу.
Скрытая медвежья дивергенция
Определение: Цена сделала более низкий максимум, а индикатор — более высокий максимум. Следует ожидать продолжения медвежьего тренда. Отмечается частично пунктирной красной линией в окнах цены и индикатора.
Доминирующий медвежий тренд с бычьими всплесками (ADX продолжает расти во время дивергенции).
Ожидать продолжения медвежьего тренда от линии бычьего тренда нелогично, поэтому этот сигнал следует принимать очень осторожно. Часто после этой дивергенции рынок входит в фазу консолидации.
В безтрендовом рынке избегайте торговли. В истощающемся медвежьем тренде, если вы решите открыть короткую позицию, используйте скальпинг.
Дивергенции на DiMinus
DiMinus (красная) — линия, отображающая силу медвежьего тренда. Способ обнаружения дивергенций между ценой и DiMinus во многом противоположен способу обнаружения дивергенций на DiPlus.
Обычная бычья дивергенция
Определение: Цена сделала более низкий минимум, а индикатор — более высокий максимум (вместо более высокого минимума). После небольшого бычьего подъема должен развиться медвежий тренд. Отмечается пунктирной светло-зеленой линией в окне цены и пунктирной темно-красной линией в окне индикатора.
Доминирующий медвежий тренд, который начинает развиваться или уже сформирован. Мы открываем короткую позицию после небольшой коррекции. В некоторых случаях дивергенция на Di- может возникать на медвежьей свече, что является хорошим подтверждением доминирующего медвежьего тренда.
Как и сигнал от Di+, иногда медвежий подъем приведет к развитию медвежьего тренда. Это может происходить при отсутствии или слабом тренде (Di+ и Di- близки друг к другу, ADX< 20) или после истощения бычьего тренда на уровнях сопротивления.
Скрытая бычья дивергенция
Определение: Цена сделала более высокий минимум, а индикатор — более высокий максимум (вместо более низкого минимума). Следует ожидать продолжения бычьего тренда. Отмечается частично пунктирной зеленой линией в окне цены и частично пунктирной темно-красной линией в окне индикатора.
Нелогично ожидать продолжения бычьего тренда от линии Di-. Для этого нужны медвежьи всплески в бычьем тренде.
Обычная медвежья дивергенция
Определение: Цена сделала более высокий максимум, а индикатор — более низкий минимум (вместо более высокого максимума). После медвежьего спада в цене следует ожидать продолжения бычьего тренда. Отмечается пунктирной темно-красной линией в окне цены и пунктирной светло-зеленой линией в окне индикатора.
Рекомендуется открывать длинные позиции в сильном и развивающемся бычьем тренде. Но в истощающемся и завершенном бычьем рынке — открывать короткие позиции.
Скрытая медвежья дивергенция
Цена сделала более низкий максимум, а индикатор — более низкий минимум (вместо более высокого максимума). Следует ожидать продолжения медвежьего тренда. Отмечается частично пунктирной красной линией в окне цены и частично пунктирной зеленой линией в окне индикатора.
Один из лучших сигналов этого индикатора, главным образом потому, что ожидается немедленное продолжение медвежьего тренда, и мы можем минимизировать стоп-лоссы. Стоп-лосс следует разместить на минимуме свечи дивергенции.
Мгновенные оповещения в Telegram
Если у вас настроен бот и канал в Telegram, индикатор ADX Divergences будет отправлять вам сообщения о подтвержденных сигналах по валютной паре, на которую вы его применяете. Учтите, что сигналы будут приходить только по тем, для которых вы выбрали «Да» в отображении. Вы можете настроить этого торгового робота на отправку мгновенных оповещений Telegram напрямую на ваш ПК, планшет или мобильный телефон.
ВАЖНО: Пожалуйста, убедитесь, что ваш часовой пояс правильно настроен на местное время (нижний правый угол приложения).
Оповещения на рабочем столе
Если вы выберете «Да», индикатор ADX Divergences будет показывать уведомления о подтвержденных сигналах на вашем персональном рабочем столе.
Email-оповещения
Для работы этой функции необходимо сначала настроить отправку email в cTrader (Настройки-> Email). Если вы выберете «Да», индикатор ADX Divergences будет отправлять email с подтвержденными сигналами на указанный вами адрес.
Сводка
This indicator detects divergences on both Di+ and Di- lines, allowing traders to analyze signals with additional context from the other directional lines and ADX levels. The Di+ and Di- lines are smoothed using a Hull moving average, adjustable via settings to control signal sensitivity and display preferences.
Divergence signals are confirmed at the opening of the bar following the divergence, with guidance provided on interpreting various divergence types—regular and hidden bullish and bearish divergences—on both Di+ and Di- lines. Users are advised to consider ADX levels, the distance between Di+ and Di-, and the direction and level of each line before trading signals.
The indicator supports instant alerts via Telegram messages, desktop notifications, and email, configurable within the platform. Proper time zone settings are required for accurate alert timing. This tool is applicable across multiple markets including Forex, commodities, indices, stocks, and cryptocurrencies such as BTCUSD and XAUUSD.
Отзывы покупателей
5 | 100 % | |
4 | 0 % | |
3 | 0 % | |
2 | 0 % | |
1 | 0 % |


![Логотип продукта "[Hamster-Coder] Bollinger Bands"](https://cdn.ctrader.com/image/webp/21d8e5d6-fb11-4bac-b9ee-cd05c2b76804_30327)