


Açıklama
FİKİR
Ayrı manuel referanslara dayanmak yerine aynı otomatik olarak algılanan swing yapısını paylaşan dört Fibonacci aracı ve üç geometrik araç.
SORUN
Her araç kendi swing seçimini gerektirdiğinde geometrik analiz sıkıcı hale gelir.
Swing'i bulun.
Retracement'i çizin.
Aynı swing'i tekrar bulun.
Fan'ı çizin.
Pitchfork için üç swing bulun.
Kanalı ayarlayın.
Fiyat yeni bir swing oluşturduğunda her şeyi yeniden çizin.
Ancak manuel çalışmanın ötesinde başka bir sorun daha var.
Her araç bağımsız olarak oluşturulduğunda, biraz farklı swing referansları kullanabilirler.
Retracement bir hareketi tanımlayabilir.
Fan başka bir hareketi tanımlayabilir.
Pitchfork farklı bir üç noktalı diziyi kullanabilir.
Ortaya çıkan projeksiyonlar bireysel olarak faydalı görünebilirken aslında piyasanın farklı bölümlerini tanımlıyor olabilir.
Sorun sadece geometrinin yeniden çizilmesi değil. Geometrinin aynı temel yapıya bağlı kalmasıdır.
TEMEL KONSEPT: SWINGLER OTOMATİKTİR. GEOMETRİ TUTARLI KALIR.
Auto-Draw Fibonacci Suite temel swing yapısını bir kez algılar.
Etkinleştirilen geometrik araçlar daha sonra aynı yapıyı otomatik olarak kullanır.
Bu, farklı geometrik ölçümler arasında ortak bir referans sistemi oluşturur.
Bir swing haritası. Birden fazla geometrik görünüm.
Geometri, swing yapısı geliştikçe değişebilir, ancak temel referans tutarlı kalır.
Amaç yedi bağımsız sinyal oluşturmak değil.
Farklı geometrik araçların aynı piyasa yapısını tanımlamasına izin vermektir.
NE YAPAR
Gösterge yedi geometrik aracın oluşturulmasını ve bakımını otomatikleştirir:
- Fibonacci Retracement
- Fibonacci Expansion
- Fibonacci Fan
- Fibonacci Time Zones
- Andrews Pitchfork
- Equidistant Channel
- Gann Fan
Her araç için referans noktalarını manuel olarak seçmek ve güncellemek yerine, suite bunları ortak swing algılamasından türetir.
Yeni bir swing geliştiğinde, ilgili projeksiyonlar otomatik olarak güncellenir.
Geometri yapıyı takip eder.
NASIL ÇALIŞIR
Süreç kasıtlı olarak basittir.
1. Swingleri algıla.
Gösterge, regresyon tabanlı algılama motorunu kullanarak swing noktalarını tanımlar.
2. Swing yapısını oluştur.
Swingler sınıflandırılır ve tutarlı bir diziye organize edilir.
3. Geometrik projeksiyonları yap.
Her etkin araç uygun swing referanslarını otomatik olarak kullanır.
4. Fiyatın gelişmesine izin ver.
Yeni bir swing oluştuğunda, aktif projeksiyonlar güncellenir.
Yedi aracı yeniden çizmezsiniz.
Geometri yapıyı takip eder.
YEDİ ARAÇ. BİR REFERANS SİSTEMİ.
Suite dört Fibonacci tabanlı aracı içerir:
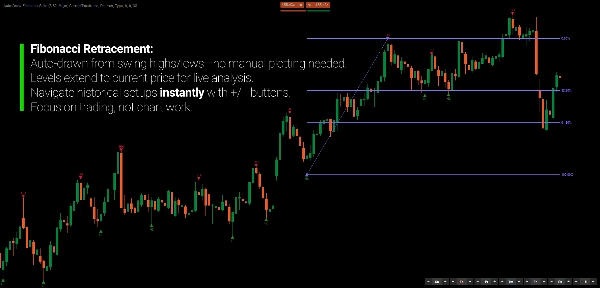
Fibonacci Retracement
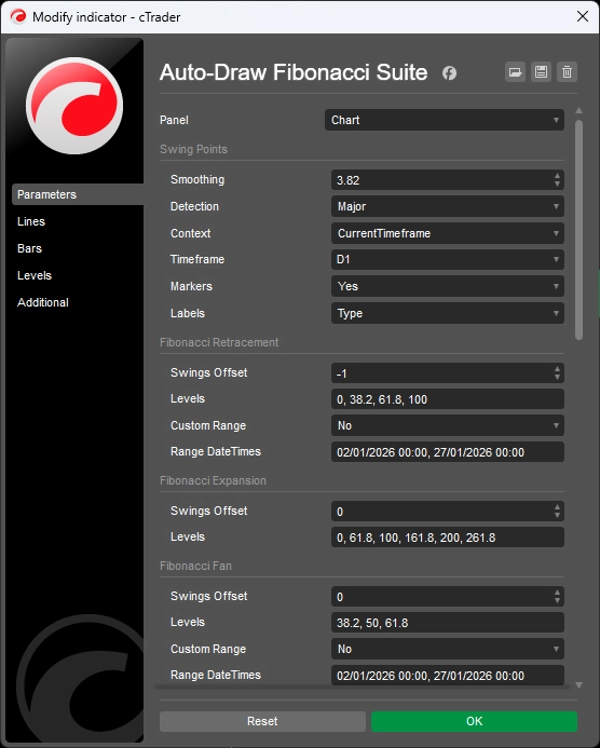
Yapısal swingler arasında yatay oransal seviyeler, %0, %38,2, %61,8 ve %100 dahil.
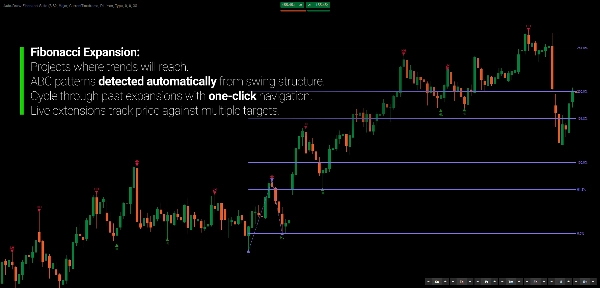
Fibonacci Expansion
Üçüncü swingin ötesinde Fibonacci ilişkilerini projekte eder.
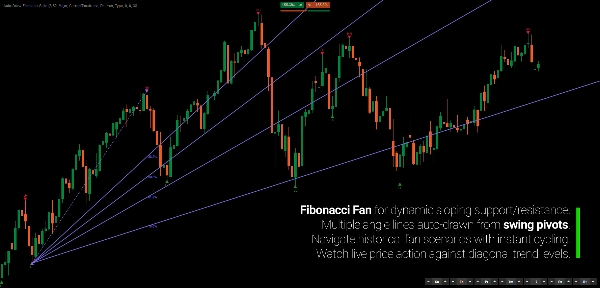
Fibonacci Fan
Yapısal pivotlardan diyagonal Fibonacci ilişkilerini projekte eder.
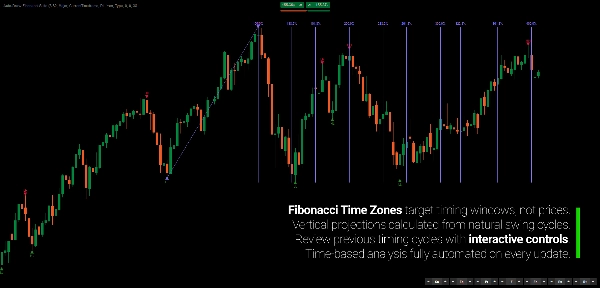
Fibonacci Time Zones
Zaman ekseni boyunca Fibonacci tabanlı aralıkları projekte eder.
Ve üç tamamlayıcı geometrik araç:
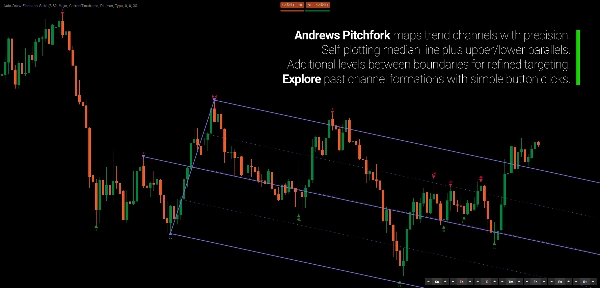
Andrews Pitchfork
Paralel kanallarla üç noktalı orta çerçeve.
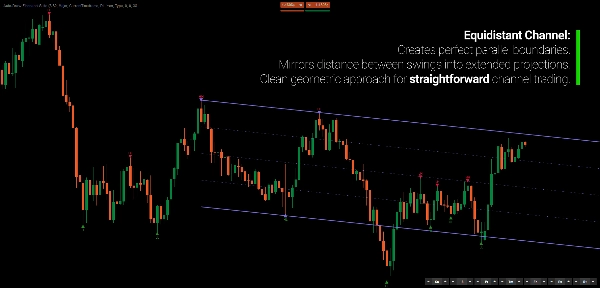
Equidistant Channel
Ara seviyelerle paralel fiyat sınırları.
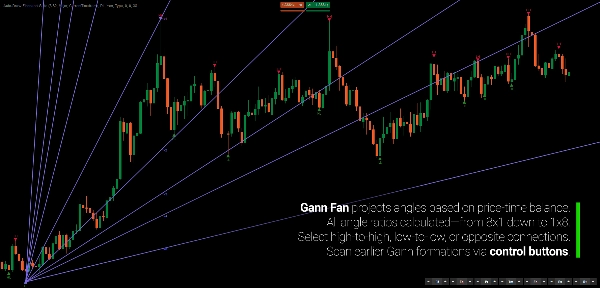
Gann Fan
8x1, 4x1, 2x1, 1x1, 1x2 ve diğerleri dahil olmak üzere çoklu geometrik oranlarda fiyat-zaman açı projeksiyonları.
Her araç bağımsız olarak etkinleştirilebilir.
SWING BİR KEZ ALGILANIR
Bu, suite'nin temelidir.
Geleneksel manuel analizle, her geometrik araç biraz farklı pivotlar kullanabilir.
Auto-Draw Fibonacci Suite bunları aynı temel swing algılamasına bağlı tutar.
Bu, farklı projeksiyonlara ortak bir referans sağlar.
Geometri tutarlı kalır çünkü kaynak yapı tutarlı kalır.
NE KADAR YAPI İSTEDİĞİNİZİ SEÇİN
Her grafik aynı detay seviyesini gerektirmez.
Üç swing hassasiyeti arasından seçim yapın:
Major
Daha az, daha geniş swingler için üst düzey bir görünüm.
Standard
Gelişmekte olan swing yapısının dengeli bir görünümü.
Minor
İç hareketi incelemek için daha ayrıntılı swingler.
Swingler ayrıca şu şekilde sınıflandırılabilir:
- HH
- HL
- LH
- LL
Ek swing bilgileri derinlik, hacim ve süreyi içerir. Görsel işaretler onaylanmış swingleri, onaylanmamış swingleri ve iç swingleri ayırt eder.
Amaç her piyasaya tek bir yapı tanımı zorlamak değildir.
İncelediğiniz harekete uygun detay seviyesini seçin.
YAPI İÇİNDE GERİYE DOĞRU HAREKET EDİN
Geometri en son swing'e kilitli kalmak zorunda değildir.
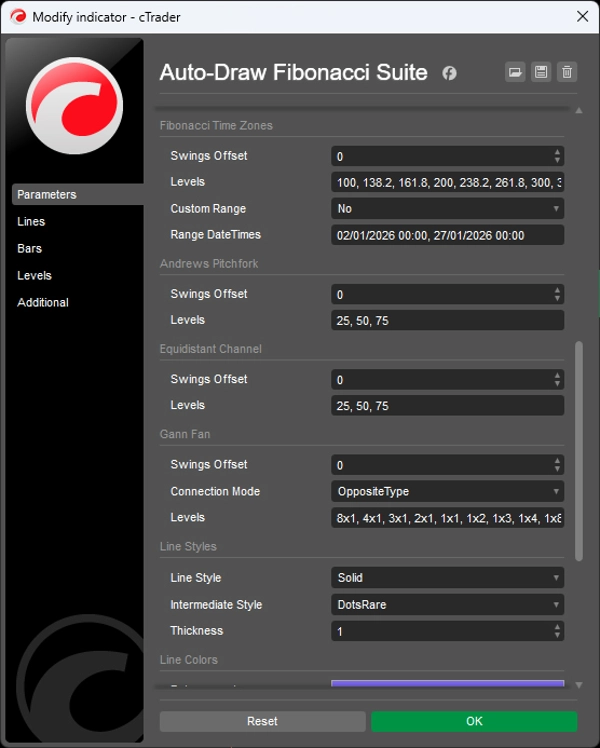
Her aracın kendi offset kontrolü vardır:
0 → mevcut swing yapısı
-1 → önceki yapı
-2 → iki yapı gerisi
Bu, araçları manuel olarak yeniden inşa etmeden piyasanın önceki noktalarında geometrik ilişkilerin nasıl göründüğünü keşfetmenizi sağlar.
Ayrıca bir projeksiyonun referansını diğerlerini değiştirmeden değiştirebilirsiniz.
Yapı otomatikleştirilmiştir. Referans kontrolünüz altındadır.
DAHA YÜKSEK ZAMAN DİLİMİ GEOMETRİSİ DAHA DÜŞÜK ZAMAN DİLİMİ GRAFİĞİNDE
Swing algılama daha yüksek bir zaman diliminden gelebilirken geometrik projeksiyonlar mevcut grafikte görünür kalır.
Örneğin:
Günlük swingler → H1 grafik
Bu, daha düşük zaman diliminde analiz yaparken veya işlem yaparken daha yüksek zaman dilimi geometrik bağlamının görünür kalmasını sağlar.
Zaman dilimi değiştirmeyi tekrar tekrar yapmazsınız.
Daha yüksek zaman dilimi swinglerini manuel olarak yeniden üretmezsiniz.
GEOMETRİ BİR ÖLÇÜM DİLİDİR
Fibonacci oranları, pitchforklar, kanallar, fanlar ve zaman projeksiyonları tahmin olarak ele alınmak zorunda değildir.
Fiyat, zaman ve önceki hareket arasındaki ilişkileri tanımlamanın farklı yollarını sağlarlar.
Bir retracement oransal fiyat hareketini tanımlar.
Bir fan diyagonal ilişkileri tanımlar.
Bir zaman dilimi zamansal aralığı tanımlar.
Bir kanal paralel hareketi tanımlar.
Bir pitchfork orta ilişkileri tanımlar.
Birden fazla projeksiyon birleştiğinde, bu birleşmeyi farklı ölçüm boyutları arasında geometrik bir ilişki olarak inceleyebilirsiniz.
Geometri piyasayı tanımlar. Piyasaya neden olmaz.
SİNYAL PEŞİNDE KOŞMAK İÇİN DEĞİL, ANALİZ İÇİN TASARLANDI
Auto-Draw Fibonacci Suite bir al/sat sinyal sistemi değildir.
Zaten Fibonacci ve geometrik analiz kullanan ancak çizimleri sürdürmek için zaman harcamak istemeyen tüccarlar için bir otomasyon aracıdır.
Şunları incelemek için kullanın:
- Retracementler
- Expansionlar
- Swing projeksiyonları
- Geometrik birleşim
- Fiyat kanalları
- Fiyat-zaman ilişkileri
- Daha yüksek zaman dilimi yapısı
- Fiyat gelişirken geometrik ilişkilerin evrimi
Gösterge belirli bir projeksiyonun sizin için ne anlama geldiğine karar vermez.
Geometriyi incelediğiniz yapıyla senkronize tutar.
ANA ÖZELLİKLER
- Otomatik swing algılama
- Tüm geometrik araçlarda birleşik swing referansları
- Dört Fibonacci aracı
- Andrews Pitchfork
- Equidistant Channel
- Gann Fan
- Gerçek zamanlı geometrik güncellemeler
- Major / Standard / Minor swing hassasiyeti
- HH / HL / LH / LL sınıflandırması
- Swing derinliği, hacmi ve süre metrikleri
- Yinelenen ara swingleri ortadan kaldırmak için akıllı swing gruplaması
- Her araç için bağımsız offset kontrolü
- Çok zaman dilimli swing algılama
- İsteğe bağlı bireysel araçlar
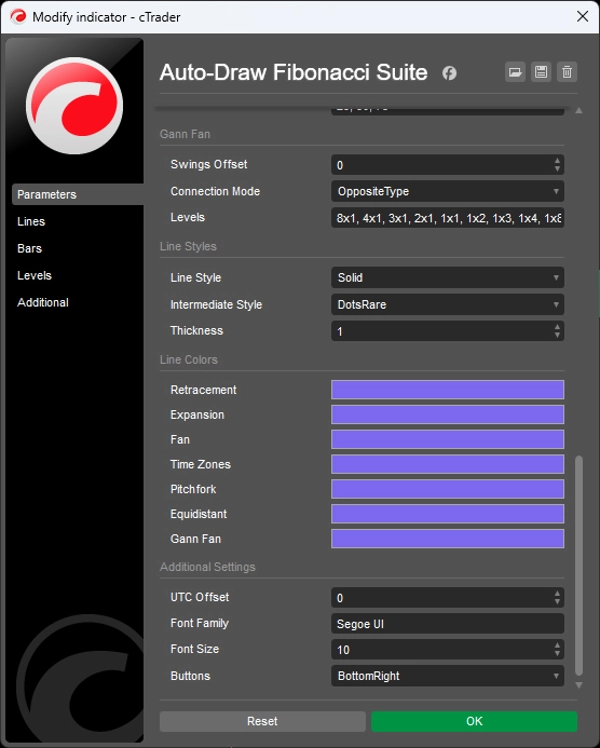
- Özelleştirilebilir Fibonacci seviyeleri ve görsel stiller
- Vurgulanmış kaynak swingleri
---
Ticaret risk içerir. Bu gösterge teknik analiz aracıdır ve uygun risk yönetimi ile birlikte kullanılmalıdır.
Özet
The indicator employs a regression-based method for swing detection, offering three sensitivity modes (Major, Standard, Minor) to tailor swing granularity. Swings are classified (higher highs, lower lows, etc.) and visually marked for clarity. Users can interactively adjust which historical swings each tool references via offset controls, enabling analysis of past structural relationships independently per tool.
Multi-timeframe support allows applying swing detection from a higher timeframe while viewing a lower timeframe chart, facilitating comprehensive structural analysis without switching views. The suite is customizable in terms of levels, colors, and styles.
Designed for traders familiar with Fibonacci and geometric analysis, it streamlines workflow by automating complex, multi-tool geometric projections, supporting swing and position traders, multi-timeframe analysts, and discretionary traders seeking coherent, real-time updated geometric market structure visualization.
Müşteri değerlendirmeleri
Tartışma
SSS






















Fiyat