Descrição
O TrendFibonacci indicador foi projetado para ajudar os traders a identificar níveis críticos de preço e tendências de mercado com precisão. Ao integrar níveis de retração de Fibonacci com uma Média Móvel Ponderada (WMA) e o Average True Range (ATR), este indicador fornece uma representação visual clara de suporte, resistência e direção da tendência.
Principais Características:
- Níveis Dinâmicos de Fibonacci: Calcula e plota automaticamente os níveis de retração de Fibonacci (padrão: 0,382 e 0,618) com base na máxima máxima e mínima mínima durante um período de análise definido pelo usuário.
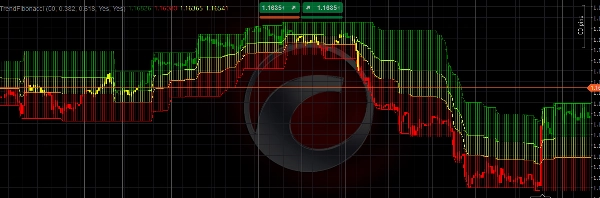
- Média Móvel Ponderada (WMA): Usa uma WMA de 6 períodos para avaliar a direção da tendência, com velas codificadas por cores (Verde para alta, Vermelho para baixa, Amarelo para neutro) para refletir a posição da WMA em relação aos níveis de Fibonacci.
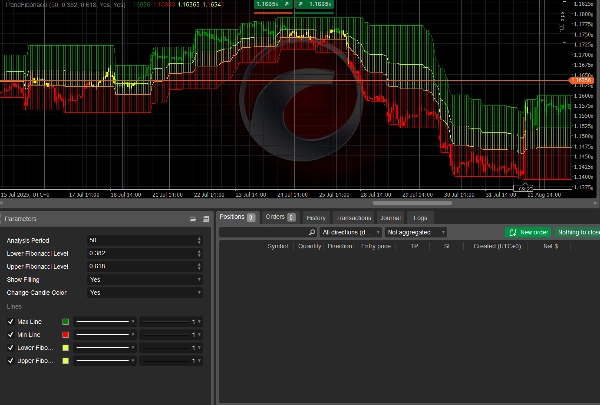
- Parâmetros Personalizáveis: Ajuste o período de análise, os níveis de Fibonacci e ative ou desative recursos como zonas preenchidas e mudança de cor das velas.
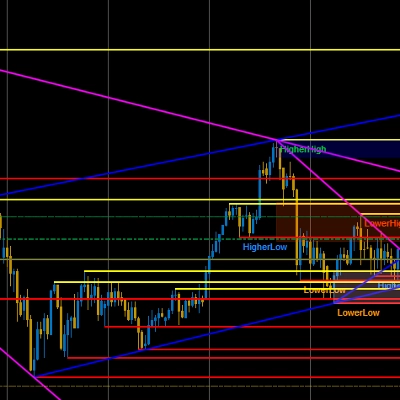
- Clareza Visual: Plota linhas de máxima/mínima e preenche áreas entre os níveis de Fibonacci com cores semi-transparentes para facilitar a identificação da tendência.
- Integração ATR: Incorpora um ATR de 200 períodos para uma análise robusta do mercado, garantindo adaptabilidade à volatilidade.
Este indicador é ideal para traders que buscam combinar análise de Fibonacci com estratégias de seguimento de tendência. Seja você um trader de forex, ações ou commodities, TrendFibonacci aprimora sua capacidade de identificar zonas-chave de reversão e tomar decisões de negociação informadas.
Como Usar
- Instale o Indicador:
-
- Adicione o TrendFibonacci indicador à sua plataforma cTrader fazendo upload do código-fonte ou baixando-o do marketplace.
- Configure os Parâmetros:
-
- Período de Análise: Defina o período de análise (padrão: 50 barras) para determinar o intervalo para calcular os preços máximos/mínimos.
- Nível Inferior de Fibonacci: Ajuste o nível inferior de retração de Fibonacci (padrão: 0,382).
- Nível Superior de Fibonacci: Ajuste o nível superior de retração de Fibonacci (padrão: 0,618).
- Mostrar Preenchimento: Ative/desative zonas preenchidas entre os níveis de Fibonacci (padrão: ativado).
- Alterar Cor da Vela: Ative/desative velas codificadas por cor com base na posição da WMA (padrão: ativado).
- Interprete o Indicador:
-
- Velas Verdes: Indicam uma tendência de alta quando a WMA está acima do nível superior de Fibonacci.
- Velas Vermelhas: Sinalizam uma tendência de baixa quando a WMA está abaixo do nível inferior de Fibonacci.
- Velas Amarelas: Sugerem uma zona neutra quando a WMA está entre os níveis de Fibonacci.
- Zonas Preenchidas: Visualizam zonas-chave de preço entre as linhas de máxima/mínima e os níveis de Fibonacci para análise de suporte/resistência.
- Aplicação na Negociação:
-
- Use o indicador para identificar potenciais pontos de entrada/saída nos níveis de Fibonacci.
- Combine com outras ferramentas técnicas (ex.: RSI, MACD) para confirmação.
- Monitore as velas codificadas por cor para avaliar a força e a direção da tendência.
- Melhores Práticas:
-
- Teste o indicador em uma conta demo para se familiarizar com seu comportamento.
- Ajuste os parâmetros para adequar ao seu estilo de negociação e condições de mercado.
- Use em timeframes maiores (ex.: H1, H4) para sinais mais confiáveis.
O TrendFibonacci indicador é uma ferramenta versátil para traders de todos os níveis, oferecendo insights claros e acionáveis sobre tendências de mercado e níveis de preço.
Resumo
Users can customize parameters such as the analysis period, Fibonacci levels, and visual features like filled zones between Fibonacci levels and candle color changes. The indicator visually highlights support and resistance zones by plotting high/low lines and filling areas between Fibonacci levels with semi-transparent colors. It is applicable across various markets including forex, stocks, commodities, and popular symbols like BTCUSD, EURUSD, GBPUSD, and XAUUSD.
TrendFibonacci supports traders in spotting potential entry and exit points at Fibonacci levels and can be combined with other technical tools like RSI and MACD for confirmation. It is recommended for use on higher timeframes (e.g., H1, H4) to enhance signal reliability.