说明
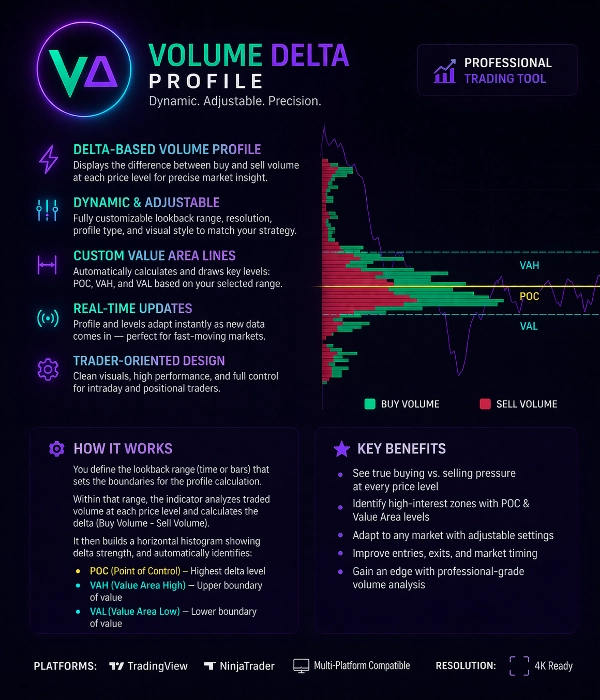
成交量增量剖面
为高级交易者提供的专业订单流洞察
成交量增量剖面是一款强大的交易工具,旨在揭示每个价格水平上买卖双方的真实平衡。
与传统的成交量剖面不同,该指标分析增量成交量(买入量 – 卖出量),以显示激进的市场参与者主导的位置。
它帮助交易者精准识别机构活动、吸收区和高关注价格水平。
核心功能
基于增量的成交量剖面
该指标计算每个价格水平的成交量增量,区分:
• 激进买入压力
• 激进卖出压力
这揭示了谁真正控制着市场。
动态且可调节的剖面范围
剖面计算范围完全可自定义。
用户可以通过以下方式定义计算区域:
• 自定义柱范围
• 交易时段范围
• 手动选择
• 滚动动态范围
剖面会随着新数据的到来自动更新。
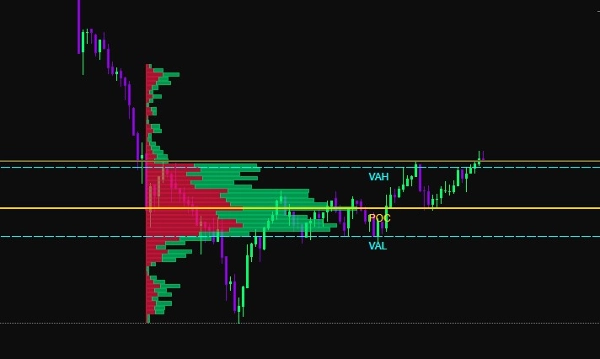
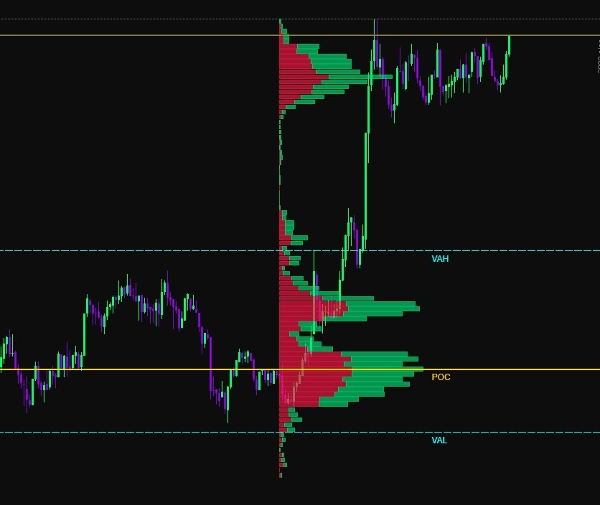
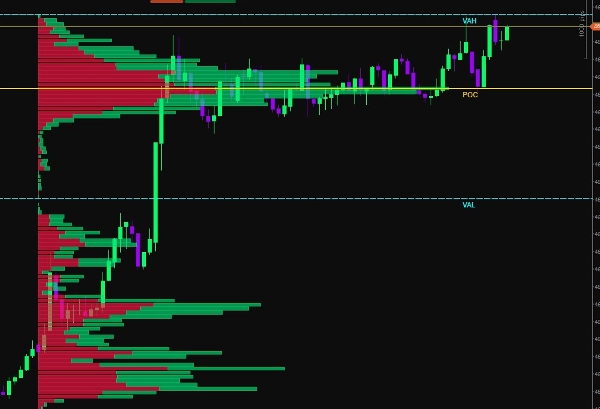
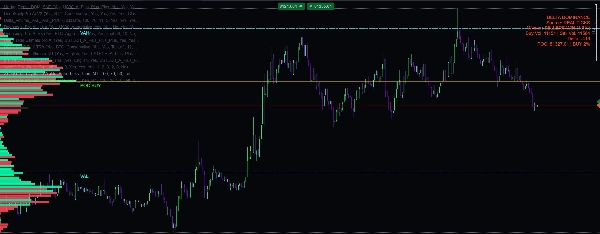
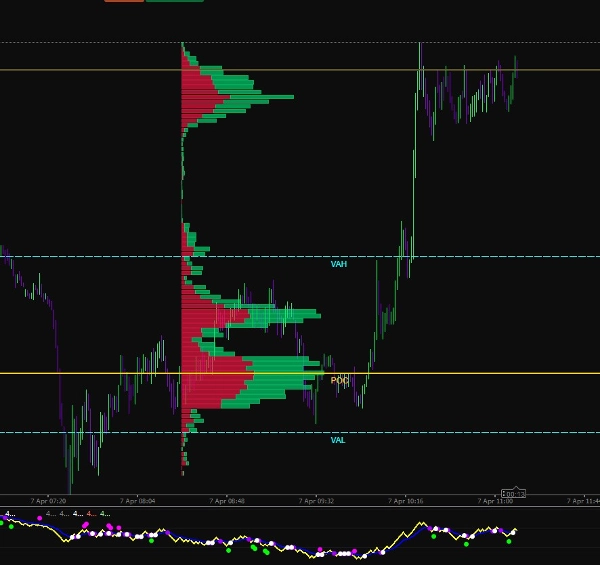
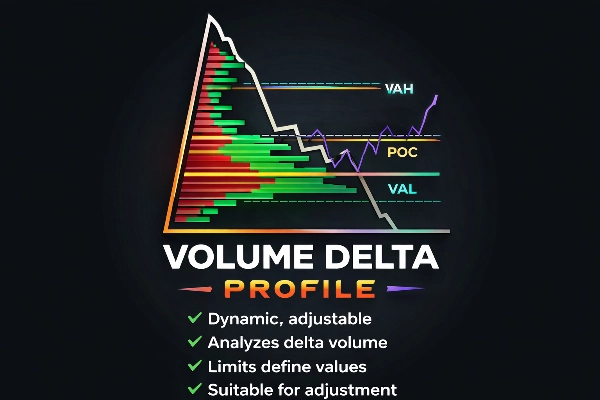
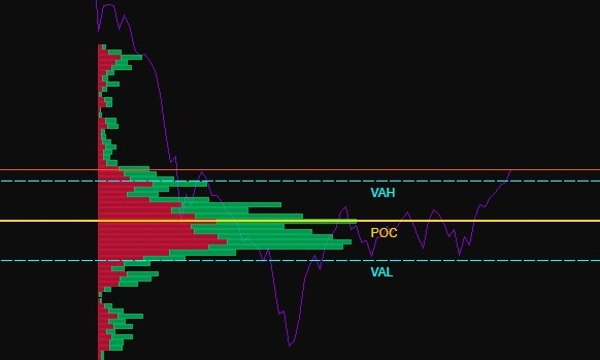
价值区检测
该指标自动计算关键的市场结构水平:
POC(控制点)
成交量增量最高的价格水平。
VAH(价值区高点)
价值区的上边界。
VAL(价值区低点)
价值区的下边界。
这些水平突出显示了大部分市场活动发生的位置。
买卖可视化
成交量以水平直方图显示:
绿色柱 → 主导买入量
红色柱 → 主导卖出量
这使交易者能够立即看到:
• 吸收区
• 失衡区域
• 流动性簇
• 机构足迹
自适应可视化
该指标包含多种视觉自定义选项:
• 可调节的直方图宽度
• 自定义配色方案
• 可调节透明度
• 分辨率控制
• 缩放自适应渲染
这确保了在所有图表时间框架上的清晰可视化。
智能边界水平
该指标绘制动态参考水平:
• POC线
• VAH线
• VAL线
这些水平会根据所选剖面范围自动更新,可用作:
• 支撑/阻力
• 均值回归区
• 突破确认水平
实时计算
成交量增量剖面持续使用实时市场数据重新计算。
这确保交易者在快速市场中始终看到最新的订单流信息。
使用场景
该工具非常适合:
• 剥头皮交易
• 日内交易
• 期货交易
• 订单流分析
• 流动性追踪
• 机构足迹检测
关键交易优势
✔ 识别真实的买卖压力
✔ 发现吸收和耗尽区
✔ 定位高流动性水平
✔ 提高入场精度
✔ 确认突破或反转
✔ 理解市场结构
技术规格
计算方法:
增量成交量 = 买入量 − 卖出量
剖面类型:
水平价格水平直方图
自动水平:
POC, VAH, VAL
更新模式:
实时动态更新
自定义设置:
• 剖面范围
• 直方图分辨率
• 成交量缩放
• 颜色设置
• 水平可见性
平台兼容性:
优化用于高性能图表渲染
为专业交易者设计
成交量增量剖面专为希望超越基础指标并理解市场真实机制的交易者打造。
通过结合成交量分析、增量计算和价值区结构,该工具提供了市场参与度和流动性分布的清晰视图。
摘要
Users can customize the profile calculation range using options such as custom bar range, session range, manual selection, or rolling dynamic range, with real-time updates as new market data arrives. Key market structure levels—Point of Control (POC), Value Area High (VAH), and Value Area Low (VAL)—are automatically calculated and drawn as dynamic reference lines, useful for support/resistance, mean reversion, and breakout confirmation.
Additional features include adjustable histogram width, color schemes, transparency, resolution control, and zoom-adaptive rendering for clear visualization across all chart timeframes. The tool supports use cases like scalping, intraday trading, futures trading, order flow analysis, liquidity tracking, and institutional footprint detection. It is optimized for high-performance chart rendering and aims to provide traders with precise insights into market participation and liquidity distribution.