
Cup Finder
Indicator
122 downloads
Version 1.0, Feb 2026
Windows, Mac
Description
The Cup Finder:
Is a high-precision technical indicator designed to identify and validate rounding price structures—commonly known as "Cups" and "Inverted Cups"—using Euclidean geometry and density-based validation.
📊 Market Analysis & Conditions
https://chartshots.spotware.com/c/6980ec8b2ee38
This indicator analyzes High and Low price pivots within a specific historical lookback period. It specifically looks for:
- Price Curvature: It identifies local peaks or troughs (30-bar window) to establish the "anchor" of a potential pattern.
- Geometric Path: It projects a mathematical semicircular arc between the anchor and the current price.
- Density Validation: Unlike visual-only tools, it calculates if a minimum percentage of bars (Content Rate) has stayed within a specific price channel around the arc.
🟢 How to Interpret Signals & Visuals
https://chartshots.spotware.com/c/6980ed1a2d9e9
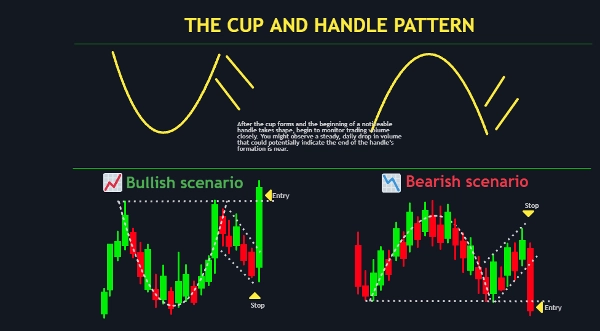
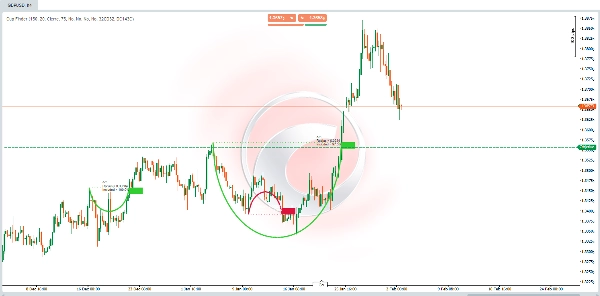
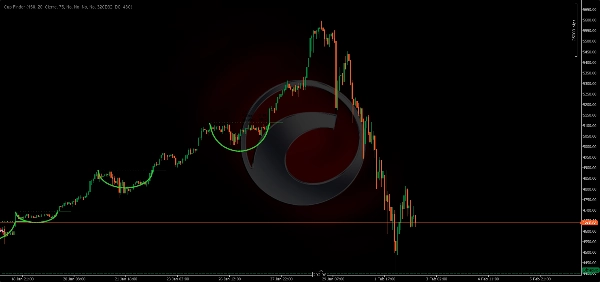
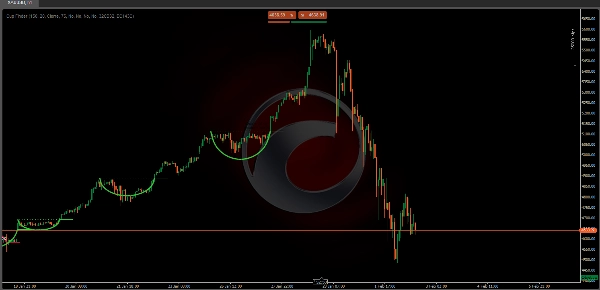
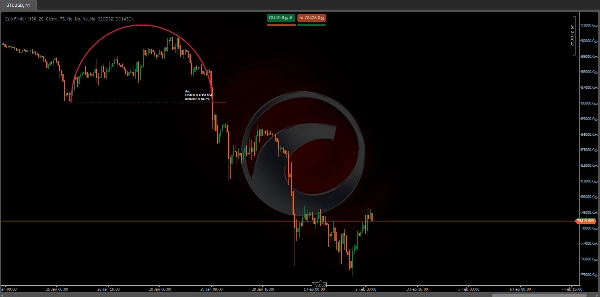
- Green Arcs (Bullish): Indicates a rounding bottom formation. Look for the horizontal dotted line, which represents the resistance "rim" level.
- Red Arcs (Bearish): Indicates a rounding top (vault) formation. The horizontal dotted line marks the support level to watch.
- Information Labels:
- Radius: Shows the depth of the pattern in price units.
- Included %: The "Geometric Accuracy" score. A higher percentage means the price followed the curve more strictly.
⚙️ Key Settings & Parameters
- Search Period (Default: 150): The number of bars the algorithm scans to find a valid historical anchor.
- Channel Amplitude (Default: 20): Defines the "thickness" of the arc's validation zone. Higher values are more permissive with price noise.
- Content Rate % (Default: 75): The minimum percentage of bars that must stay inside the arc for it to be displayed.
- Breakout Source: Choose whether the pattern is triggered by a Close or the High/Low crossing the rim line.
🚀 Typical Use Cases & Scenarios
https://chartshots.spotware.com/c/6980eefccbe38
- Breakout Trading: Enter a trade when the price breaks and closes above/below the horizontal dotted line (the rim).
- Trend Reversal Identification: Spotting "Rounding Bottoms" at the end of a downtrend or "Rounding Tops" at the end of an uptrend.
- Structural Support/Resistance: Using the rim line as a key level for placing Stop Losses or taking profits.
👤 Target Trader Profile
- Price Action Traders: Those who look for market geometry and structural exhaustion.
- Systematic Traders: Users who want to remove the subjectivity of "drawing cups" by hand and prefer a mathematical confirmation.
- Experience Level: Suitable for intermediate to advanced traders who understand breakout confirmation and support/resistance concepts.
⚠️ Important Limitations & Usage Notes
- Minimum History Required: The indicator requires at least 292 bars of data to initialize its internal calculations.
- Lagging Nature: Because it validates a curve based on historical data, the arc only appears once the "rounding" is substantially developed.
- Repainting/Updating: As price develops, the arc may adjust its radius or disappear if the "Included %" falls below your threshold.
Summary
AI summary
Cup Finder is a technical indicator designed to identify and validate rounding price patterns known as "Cups" and "Inverted Cups" using Euclidean geometry and density-based validation. It analyzes high and low price pivots over a historical lookback period to detect price curvature by identifying local peaks or troughs within a 30-bar window, establishing an anchor point for potential patterns. The indicator projects a semicircular arc between this anchor and the current price and calculates a content rate to confirm that a minimum percentage of bars remain within a defined price channel around the arc.
Visual signals include green arcs indicating bullish rounding bottoms with a horizontal dotted resistance line, and red arcs indicating bearish rounding tops with a support line. Information labels display the pattern's radius and geometric accuracy percentage. Key adjustable parameters include search period, channel amplitude, content rate threshold, and breakout source (close or high/low crossing the rim line).
Typical use cases involve breakout trading, trend reversal identification, and defining structural support or resistance levels. The indicator targets intermediate to advanced price action and systematic traders seeking mathematical confirmation of rounding patterns. It requires at least 292 bars of historical data and may repaint or update arcs as price evolves. Supported markets include Forex, stocks, commodities, indices, and cryptocurrencies such as BTCUSD, EURUSD, GBPUSD, and XAUUSD.
Indicator profile
Customer reviews
0.0
Reviews: 0
Customer reviews
No reviews for this product yet. Already tried it? Be the first to tell others!
Discussion
FAQ
BTCUSD
Forex
Breakout
Indices
EURUSD
Commodities
GBPUSD
NZDUSD
Prop
Crypto
Stocks
XAUUSD
NAS100
USDJPY
Products available through cTrader Store, including trading bots, indicators and plugins, are provided by third-party developers and made available for informational and technical access purposes only. cTrader Store is not a broker and does not provide investment advice, personal recommendations or any guarantee of future performance.


Price
Since 03/10/2024
163
Sales
39.07K
Free installs