Description
Most traders rely on lagging indicators that react to price after the move has happened. The FFT-SDE Visual Engine takes a fundamentally different, quantitative approach. It's not just an oscillator; it's a real-time signal processing and forecasting suite built directly into cTrader.
It operates on two core principles:
- The Market has Rhythms (Cycles): Using Fast Fourier Transform (FFT) analysis, the indicator decomposes price action into its core frequency components, filtering out noise to reveal the dominant, tradable cycle. This tells you when the market is likely to turn.
- Price Movement has a Statistical Nature (SDE): By modeling price as a Stochastic Differential Equation (Ornstein-Uhlenbeck process), it quantifies the market's drift (momentum), volatility (risk), and mean-reversion speed. This tells you how the market is likely to move and the probability of a successful trade.
By fusing these two worlds—Cycle Analysis (FFT) and Stochastic Forecasting (SDE)—the FFT-SDE Engine provides a holistic view of the market that is simply unavailable in standard tools.
2. Core Utility: What Problems Does It Solve?
Here’s how a trader can use this indicator to improve their decision-making:
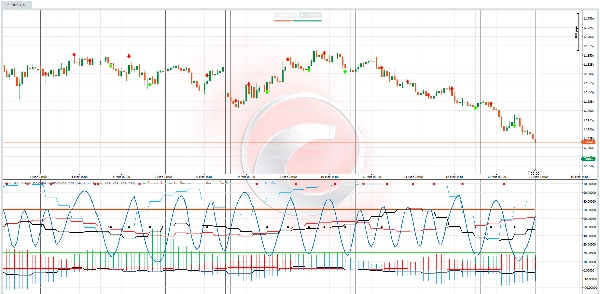
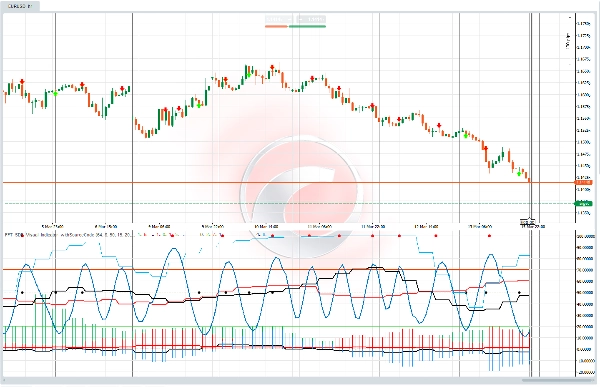
- Problem 1: "I can't tell if the market is trending or just ranging."
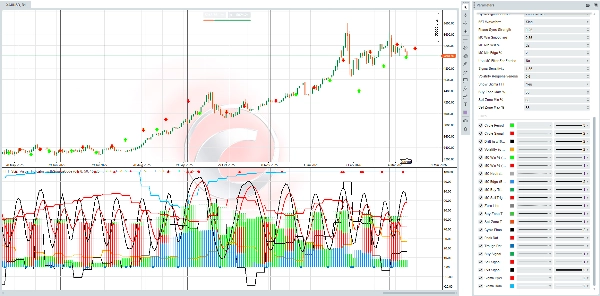
- Solution (Cycle Period & Sigma Cyclicality): The Cycle Period histogram instantly shows the length of the current dominant market cycle. When the cycle is clear and strong, you can trade the swings. When the Sigma Cyclicality % (volatility cycle) is high, you know to expect periods of expansion and contraction in risk, allowing you to adjust your position sizing dynamically.
- Problem 2: "My entries are always too early or too late."
- Solution (Cycle Phase & Entry Zones): The indicator maps the market's cycle onto a smooth 0-100% wave—the Cycle Phase % . Instead of guessing tops and bottoms, you can wait for the price to enter predefined Buy (0-35%) and Sell (60-88%) Zones. These aren't arbitrary levels; they are dynamically derived from the market's own dominant frequency, giving you a significant timing advantage.
- Problem 3: "I don't know if a setup has a high probability of success."
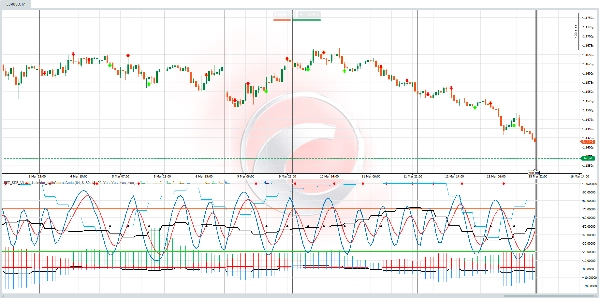
- Solution (Monte Carlo Simulation): This is the killer feature. For every bar, the engine runs hundreds of simulated price paths (Monte Carlo) based on the current market dynamics. It then outputs the MC Win % (Buy) and MC Win % (Sell) . This is not a feeling or a hunch; it's a statistical probability of a 1:2.5 risk-reward trade working out before you even enter it. You can literally see if the odds are in your favour.
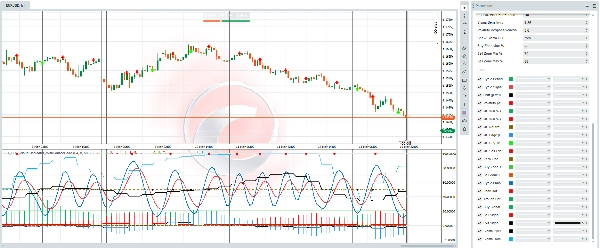
- Problem 4: "Standard indicators are too slow and noisy."
- Solution (Adaptive & Multi-Faceted): This indicator isn't static. Its Adaptive Volatility model responds in real-time to price shocks and cycle impulses. The Sigma FFT tells you if volatility itself is becoming cyclical, warning you of impending quiet or explosive periods. Every component is designed to adapt to current market conditions.
You won't find another indicator on the cTrader marketplace that combines these features into a single, coherent, and visual system.
- The "Sigma FFT" Layer: It's one thing to know that price has a cycle. It's a whole new level of sophistication to know that volatility itself has a cycle. This provides a massive edge in anticipating market structure changes.
- Probabilistic Edge, Not Certainty: The Monte Carlo outputs move the trader away from seeking "holy grail" certainty and towards a professional mindset of managing probabilities and edges.
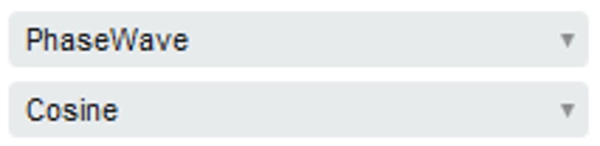
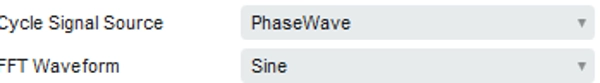
- Fully Visual & Customizable: All this complex math is presented in a clean, multi-panel format with extensive customisation (27+ parameters). You can tailor it to your specific trading style, from scalping to swing trading.
- Coherent Fusion: The cycle phase that generates your buy/sell signals is the same cycle used to calculate the drift and adaptive volatility. Every part of the indicator speaks to the others, creating a unified and consistent market model.
This indicator is perfect for the trader who:
- Is tired of lagging indicators and wants a more predictive, scientific approach.
- Has some understanding of cycles, volatility, and the value of statistical probability.
- Wants to build a robust, rules-based trading system.
- Trades instruments with cyclical behaviour (e.g., Forex pairs, Indices, Commodities like Gold).
- Is willing to invest in a professional-grade tool to gain a genuine edge in the markets.
The FFT-SDE Visual Engine transforms complex quantitative finance concepts into a practical, actionable trading tool. It moves you from guessing to knowing, from reacting to anticipating. If you're ready to trade with a deeper understanding of the market's structure and a quantifiable probabilistic edge, this is the engine you've been waiting for.
Summary
Customer reviews
5 | 67 % | |
4 | 33 % | |
3 | 0 % | |
2 | 0 % | |
1 | 0 % |