
الوصف
محلل تراجع الاتجاه
محلل تراجع الاتجاه هو مؤشر cTrader مصمم لتحليل كيفية تنفس الاتجاه عن طريق قياس عمق وتكرار التراجعات – والآن أيضًا بنسب تصحيح فيبوناتشي %.
باستخدام فلتر اتجاه قائم على EMA، يقوم المؤشر بـ:
- الكشف عن وجود اتجاه صاعد أو اتجاه هابط واضح؛
- تحديد كل تراجع مؤكد داخل ذلك الاتجاه؛
- قياس عمق التراجع بالنقاط؛
- حساب نسبة التصحيح بأسلوب فيبوناتشي نسبة إلى آخر ساق دافعة؛
- متابعة حية لـ:
-
- عدد التراجعات التي حدثت في الاتجاه الحالي،
- عمق التراجع الأخير،
- متوسط عمق التراجع،
- آخر نسبة تصحيح فيبوناتشي %.
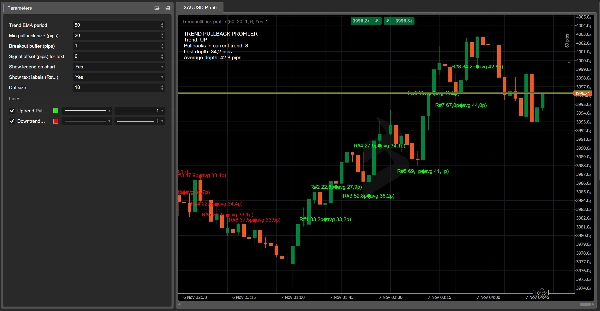
على الرسم البياني، يقوم بـ:
- رسم نقطة خضراء كبيرة عند أدنى نقطة للتراجع في اتجاه صاعد،
- نقطة حمراء كبيرة عند أعلى نقطة للتراجع في اتجاه هابط،
- طباعة ملصق مضغوط اختياري مثل:
22.5 p / 38.2%.
في الزاوية العلوية اليسرى، تعرض أسطورة ديناميكية:
- اتجاه الاتجاه الحالي (صاعد / هابط / لا شيء)؛
- عدد التراجعات في الاتجاه الحالي؛
- عمق التراجع الأخير (بالنقاط)؛
- متوسط عمق التراجع (بالنقاط)؛
- آخر نسبة تصحيح فيبوناتشي.
المعلمات الرئيسية
- فترة EMA للاتجاه
فترة EMA المستخدمة لتحديد اتجاه الاتجاه. - الحد الأدنى لحجم التراجع (بالنقاط)
الحد الأدنى المطلوب لعمق التراجع (بالنقاط) ليتم احتسابه كتراجع صالح. - فاصل الاختراق (بالنقاط)
المسافة الإضافية التي يجب أن يتحرك السعر بعدها خارج أقصى نقطة في الاتجاه السابق لتأكيد ساق جديدة وإغلاق التراجع. - إزاحة الإشارة (بالنقاط) للنص
الإزاحة الرأسية لملصقات النص نسبة إلى أعلى/أدنى نقطة للتراجع. - عرض الأسطورة على الرسم البياني
تبديل عرض الأسطورة على الرسم البياني مع الاتجاه، وآخر وأوسط المقاييس. - عرض ملصقات النص بالقرب من النقاط
إذا تم التمكين، يطبع ملصقًا صغيرًا بجانب النقطة مع عمق التراجع (واختياريًا نسبة فيبوناتشي %). - عرض نسبة فيبوناتشي % في الملصقات
إذا تم التمكين، يعرض كل من النقاط ونسبة فيبوناتشي % في الملصق (XX.Xp / YY.Y%). - حجم النقطة
يتحكم في حجم ظهور النقاط على الرسم البياني، مما يجعل التراجعات سهلة الرصد حتى على الأطر الزمنية الأقل.
حالات الاستخدام العملية
- تصوير بصري لمدى عمق التراجعات عادةً على رمز/إطار زمني معين.
- تخطيط إدخالات الحد حول مناطق التصحيح النمطية بدلاً من المستويات العشوائية.
- رصد التراجعات العميقة غير المعتادة (على سبيل المثال، تتجاوز 61.8% أو 78.6%) التي قد تشير إلى نفاد الاتجاه أو احتمال انعكاس.
- إضافة معلومات موضوعية رقمية عن التراجع وفيبوناتشي إلى دليل تداول الاتجاه الخاص بك.
كيفية حساب تصحيح فيبوناتشي في محلل تراجع الاتجاه
يقوم محلل تراجع الاتجاه بحساب نسبة التصحيح بأسلوب فيبوناتشي بناءً على آخر ساق دافعة في الاتجاه، وليس على القمم والقيعان العشوائية.
في اتجاه صاعد
- يتتبع المؤشر ساق دافعة من:
-
- سعر قاعدة الاتجاه = آخر قاع مهم (نهاية التراجع السابق)
- أقصى نقطة في الاتجاه = آخر قمة تأرجح في الاتجاه
- عندما يتشكل تراجع، يقيس المؤشر:
-
- عمق التراجع (السعر):
depthPrice = trendHigh – pullbackLow - حجم الساق الدافعة:
legSize = trendHigh – trendBasePrice
- عمق التراجع (السعر):
- نسبة تصحيح فيبوناتشي هي:
Fib% = (depthPrice / legSize) * 100
لذا إذا تراجع السعر تقريبًا بنسبة 38.2%–50% من آخر دفعة قبل الاستمرار في الصعود، سترى قيمًا قريبة من 38.2%، 50%، 61.8%، وهكذا.
في اتجاه هابط
- تبدأ الساق الدافعة من:
-
- سعر قاعدة الاتجاه = آخر قمة مهمة (نهاية التراجع السابق)
- أقصى نقطة في الاتجاه = آخر قاع تأرجح في الاتجاه
- يتحرك التراجع صعودًا عكس الاتجاه، ويقيس المؤشر:
-
- عمق التراجع (السعر):
depthPrice = pullbackHigh – trendLow - حجم الساق الدافعة:
legSize = trendBasePrice – trendLow
- عمق التراجع (السعر):
- نفس الصيغة:
Fib% = (depthPrice / legSize) * 100
بهذه الطريقة، تمثل كل نقطة تراها على الرسم البياني تراجعًا داخل دفعة واضحة من الاتجاه الحالي، معبرًا عنها بالنقاط و بنسبة فيبوناتشي %، حتى تتمكن من الحكم بسرعة إذا كان التصحيح سطحيًا، نمطيًا، أو عميقًا بشكل غير معتاد.
الملخص
Key features include:
- Detection of trend direction and pullbacks.
- Measurement of pullback depth and Fibonacci retracement percentage.
- Live tracking of the number of pullbacks, last pullback depth, average pullback depth, and last Fibonacci retracement percentage.
- Visual chart elements such as large green dots at pullback lows in uptrends and large red dots at pullback highs in downtrends.
- Optional compact labels displaying pullback depth and Fibonacci percentage.
- A dynamic legend showing current trend direction, pullback counts, and metrics.
The Fibonacci retracement is calculated based on the last impulse leg, defined by the last significant trend base and extreme prices, providing objective numeric data to assess whether retracements are shallow, typical, or unusually deep. The indicator supports various markets including Forex, indices, commodities, cryptocurrencies, and stocks. It offers configurable parameters such as EMA period, minimum pullback size, breakout buffer, and display options for labels and legend.
تقييمات العملاء
5 | 50 % | |
4 | 50 % | |
3 | 0 % | |
2 | 0 % | |
1 | 0 % |


