present
Regístrese y obtenga 50 $ de descuento en su primera compra
Trading product for Minibull Location of the Price and Volume Indicador SMA Key Levels, image 1
Minibull Location of the Price and Volume
Indicador
Versión 1.0, Jul 2026
Windows, Mac
Trading product for Minibull Location of the Price and Volume Indicador SMA Key Levels, image 2
Trading product for Minibull Location of the Price and Volume Indicador SMA Key Levels, image 3
Trading product for Minibull Location of the Price and Volume Indicador SMA Key Levels, image 4
Trading product for Minibull Location of the Price and Volume Indicador SMA Key Levels, image 5
Trading product for Minibull Location of the Price and Volume Indicador SMA Key Levels, image 6
Trading product for Minibull Location of the Price and Volume Indicador SMA Key Levels, image 7

Descripción

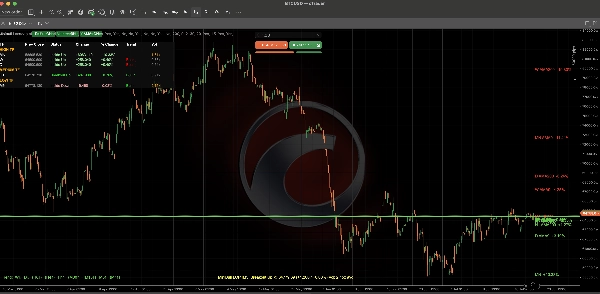
MiniBull Ubicación del Precio (LOP) muestra exactamente dónde se encuentra el precio en comparación con la última barra cerrada en cada marco temporal que importa: Mensual, Semanal, Diario, H8, H4, H1, M30, M15, M5, M1 (configurable; cinco activos por defecto).

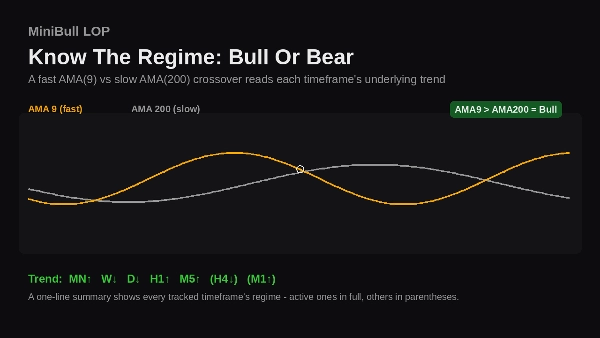
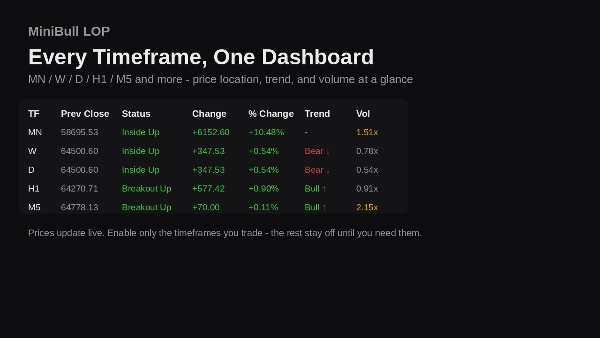
Para cada marco temporal: cierre previo, cambio absoluto y %, una lectura de tendencia Alcista/Bajista a partir de un cruce dual AMA (9/200), y una proporción de volumen de ticks frente a su propio promedio, en un panel de control en el gráfico que se activa con un clic.

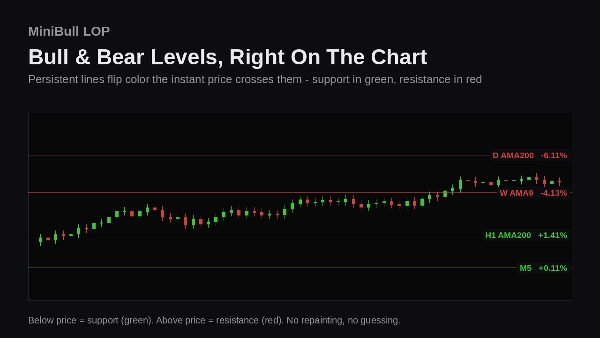
Líneas persistentes codificadas por colores (verde = soporte, rojo = resistencia) marcan cada nivel en el gráfico y se actualizan en vivo, para que siempre sepas dónde está el precio sin abrir una ventana secundaria.

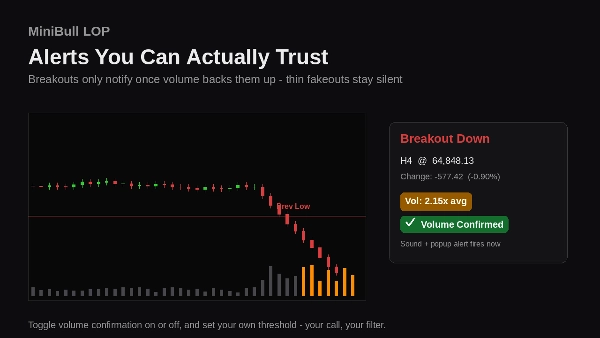
Alertas de ruptura (sonido + ventana emergente) se activan cuando el precio supera un máximo o mínimo previo, opcionalmente requiriendo confirmación de volumen, filtrando falsas rupturas débiles y sin convicción.

Un resumen compacto de la tendencia en la parte inferior del gráfico ofrece una lectura del estado del mercado en una línea a través de cada marco temporal rastreado, activo o no.

Diseñado para traders que piensan en múltiples marcos temporales: detectar alineaciones, detectar divergencias, nunca perder de vista el precio respecto a ayer, la semana pasada o el mes pasado.

Resumen

Resumen de IA
Minibull Location of the Price and Volume is a multi-timeframe trading indicator designed to display the current price position relative to the last closed bar across key timeframes including Monthly, Weekly, Daily, and intraday intervals (H8, H4, H1, M30, M15, M5, M1). It provides a compact on-chart dashboard showing previous close, absolute and percentage price changes, a Bull/Bear trend signal derived from a dual Adaptive Moving Average (AMA) crossover (periods 9 and 200), and a tick-volume ratio compared to its average. The indicator features persistent, color-coded support (green) and resistance (red) lines that update live on the chart, enabling quick visual identification of key levels without opening additional windows. Breakout alerts with sound and popup notifications trigger when price surpasses prior highs or lows, with optional volume confirmation to reduce false signals. A concise trend summary at the chart’s bottom offers a one-line market mood overview across all tracked timeframes. This tool is intended for traders analyzing price and volume alignment or divergence across multiple timeframes to maintain situational awareness of price relative to recent closes.
Perfil del indicador
Categoría del indicador
Tendencia
Tipo de resultado
Visualización
Señales
Requisitos de datos
Únicamente barras
Volumen
Señales admitidas
Cruce
Ruptura
Ruptura de nivel

Valoraciones de clientes

0.0
Valoraciones: 0
Valoraciones de clientes
Este producto todavía no se ha valorado. ¿Ya lo ha probado? Sea el primero en informar a otros.

Conversación

Preguntas frecuentes

SMA
Key Levels
Volume
Moving Average
Support & Resistance
Los productos disponibles a través de cTrader Store, incluidos bots, indicadores y plugins para operar, son proporcionados por desarrolladores de terceros y están disponibles únicamente con fines informativos y de acceso técnico. cTrader Store no es un bróker, por lo que no proporciona asesoramiento de inversión, recomendaciones personales ni ninguna garantía de rentabilidad futura.

Más de este autor

Indicador
CCI
EMA
+5
Streamline your focus. Stop juggling multiple timeframes and view them all on a single char
Indicador
EMA
Moving Average
+2
Trade the Trend. Ignore the Noise
cBot
Fixed Lot
SL Manager
+5
Minibull AMA Sniper Pro: Filter the noise, secure the trend. Precision entries backed by bulletproof risk management.
1.17
Factor de beneficio
Indicador
ATR
EMA
+3
Trend is your friend. Be Logical
cBot
Channel
Conservative
+3
Trade With the Trend.Enter With Precision.Multi-timeframe logic filters the noise and captures high-probability reversal
1.46
Factor de beneficio
Indicador
SMA
Channel
+2
MiniBull Gold vs Indices is a non-repainting Balance-of-Powers indicator that tracks GOLD against three major indices.
cBot
ATR
Break Even
+4
Four markets, one divergence, one signal. Trade the reversal, manage the risk automatically
1.34
Factor de beneficio

Puede interesarle

Indicador
Imbalance
Key Levels
+2
A Next-Generation Adaptive Oscillator with Z-Score Regime Engine.
Indicador
Imbalance
Risk Dashboard
+2
FX‑DESK RISK MANAGEMENT — Cross‑Asset Correlation Heatmap, Info Panel & Trade Signals
Indicador
Forex
BTCUSD
+12
Pro Structure Patterns Detector
Indicador
Forex
Crypto
+4
Statistical boundaries that adapt to real-time volatility for a better risk management.
Indicador
AI
ATR
+27
The Fibonacci Automated Levels Indicator is a smart trading tool that automatically detects the most recent market.
Indicador
Prop
Institution-level trend Analyzer.
Indicador
AI
RSI
+19
The HAI Quantum V10 is an advanced indicator designed for technical analysis.
Logotipo de "BvsB 2026"
Mejor valorado
4.7
(4)
$100
Indicador
Prop
Forex
+1
Smart support/resistance indicator with rejection-only Buy/Sell signals designed for H1 charts.
Indicador
Prop
Forex
+3
Price Change Bundle 3-in-1 Levels • Bars • Histogram. Secret of Price Change
Indicador
Volume
Imbalance
+5
Professional OrderFlow Footprint Analysis ( Bid/ask, POC, VA, Delta, Absorption, Imbalance )
Indicador
ADX
ATR
+3
Nine live gauges turn raw market data into one clear dashboard. Trend, volume, volatility - at a glance, any symbol.
Indicador
ATR
BOS
+5
Apex Strike: Multi-timeframe (M5-H1) non-repainting indicator with winrate dashboard & alerts (Gold, BTC).
Indicador
ATR
Signal
One of the best indicators we have ever developed, with a very high profit ratio.
Indicador
ADX
ATR
+5
Lorentzian Distance k-NN classifier with kernel regression, BUY/SELL alerts and a collapsible on-chart panel.
Indicador
RSI
Forex
+10
All in One indicator designed to reveal Market Sentiment.
Indicador
Grid
Prop
+5
This technical analysis indicator provides information on market sentiment, trend and price levels....
Indicador
SMC
Prop
+5
Automatically draws the Opening Range (High & Low) for Tokyo, London, and New York sessions. Configurable start times,
Indicador
ATR
BOS
+2
OA Pulse turns multi-timeframe currency, pullback zones, and relative volatility into one concise cTrader dashboard.

Precio