Brokers & props
For business
00
Days
:
00
Hours
:
00
Minutes
:
00
Seconds
50 percent
"50 percent" logo
Since 14/05/2025
Traded volume
10.1M
Pips won
81.44K
Free installs
107
"50 percent" uploaded image"50 percent" uploaded image

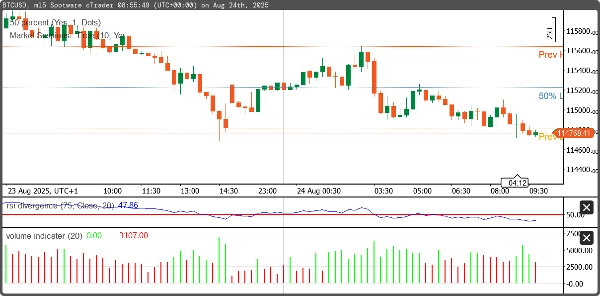
This cBot automatically detects the previous session’s high and low prices and calculates the midpoint between them. It is designed to assist traders by identifying key support/resistance zones and market equilibrium levels, which are often used for reversal or breakout strategies.


  • Detects the previous day’s (or session’s) high and low.
  • Calculates the midpoint between the high and low.
  • Plots the high, low, and midpoint levels on the chart.


0.0
Reviews: 0
Customer reviews
No reviews for this product yet. Already tried it? Be the first to tell others!
More from this author
Exponential Moving Average Sample (2)
This algo uses two Exponential Moving Averages (EMAs): EMA 21 (fast) → reacts quickly to price changes. EMA 34 and 21
You may also like
Indicator
RSI
Breakout
XAUUSD
+7
Candle Strength Oscillator
The Candle Pressure Index is a powerful, user-friendly indicator that reveals hidden market pressure inside candles.
Indicator
RSI
Breakout
XAUUSD
+5
Zones Supply Demand
📊Zones Supply & Demand: Identifies key price levels with high volume concentration, marking Supply/Demand Zones & Marke
Indicator
NAS100
NZDUSD
XAUUSD
+14
Volume Profile Pivot Anchored
Anchor volume profiles to pivots with POC, VAH, VAL and real-time insights for clearer trade decisions.
Indicator
RSI
Breakout
Supertrend
+1
Reactive Moving Average
Combines SMA with dynamic correlation to adapt to market trends. Adjusts sensitivity, filters noise🚀📉
Indicator
Grid
RSI
XAUUSD
+14
Trend Entropy pro
Entropy is the scientific measure of disorder or uncertainty in a system
Indicator
NAS100
Indices
Prop
+6
VolumeThermometer
Heatmap of intra-HTF volume (POC/VA) built from LTF tick data; paints current candle and auto-loads visible history.
Indicator
Indices
Stocks
Commodities
+2
Price-Time Filtering
Trend filter based on Alfred François Tagher's price-time methodology. Identifies trends when close breaks prior period'
Indicator
NAS100
NZDUSD
XAUUSD
+10
Nebula Range Filter Pro
⚡Nebula Range Filter is a professional trend filter indicator for cTrader⚡
Indicator
Signal
Scalping
Major Tops and Bottoms
Average accuracy of around 60% to 70% on 45min timeframes it is highly recommended to use stop losses
Indicator
NAS100
NZDUSD
RSI
+11
RSI Channel Trigger
🧠Visually marks momentum zones when the RSI crosses the overbought/oversold thresholds (default 70/30). ✅
Indicator
Indices
Prop
Commodities
+3
[Hamster-Coder] Moving Average MTF
Universal multi time frame 'Moving Average' indicator with extended features
Indicator
Indices
RSI
Prop
+4
CG Swing Signal
One of the best indicators we have ever developed, with a very high profit ratio.
IR Slowing Moving
Add Slowing to IR Moving Average.
Indicator
Breakout
Bollinger
Pressure Scanner
Pressure Scanner is a volatility-and-momentum to show both pressure states (squeeze on/off) and directional
Indicator
Stocks
Forex
MACD
MACDVolume
😎Read the description before purchasing💩
Indicator
Indices
MFI-MTF
MFI- MTF is a multi-timeframe momentum indicator that brings higher timeframe perspective to your current chart
Indicator
NAS100
Indices
NZDUSD
+9
VMM PositionPivotPro
Professional position management! Calculate real-time pivots, monitor P&L & costs, and strengthen your strategy.
Indicator
NAS100
NZDUSD
Breakout
+12
Multi_TF Candlestick Chart Overlay
Perfect for traders who demand a clear overview of multiple timeframes at a glance.