Описание
Индекс Давления Свечи (CPI) — мощный, но простой в использовании индикатор, предназначенный для выявления скрытого давления покупателей и продавцов за каждой свечой. Вместо того чтобы просто показывать, поднялась ли цена или опустилась, CPI глубже анализирует, насколько сильно покупатели или продавцы контролировали рынок внутри каждой свечи. Это делает его уникальным инструментом для определения силы тренда, раннего обнаружения разворотов и подтверждения точек входа или выхода с большей точностью.
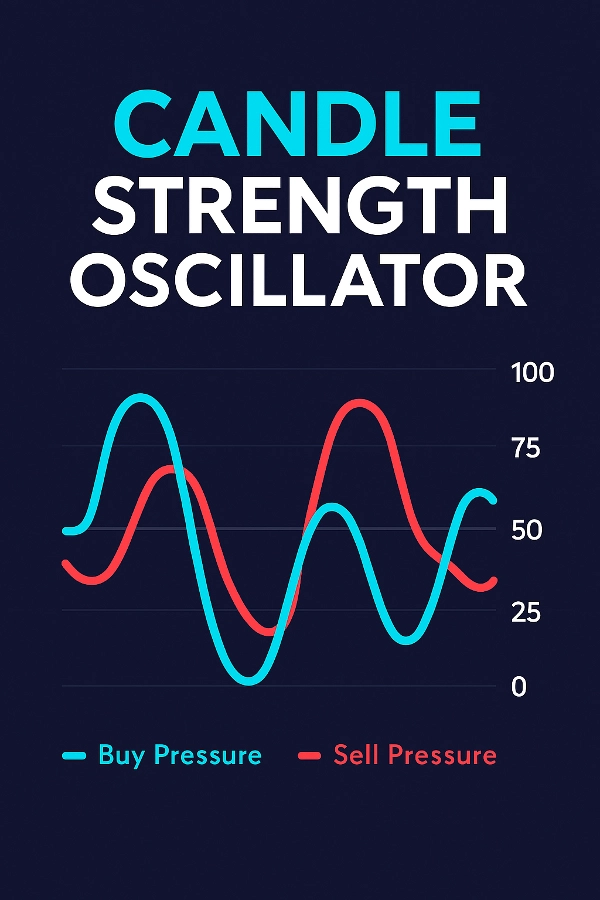
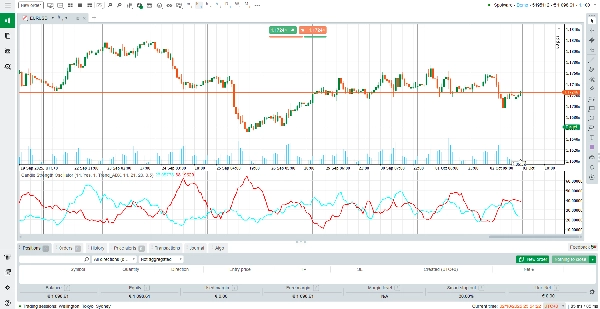
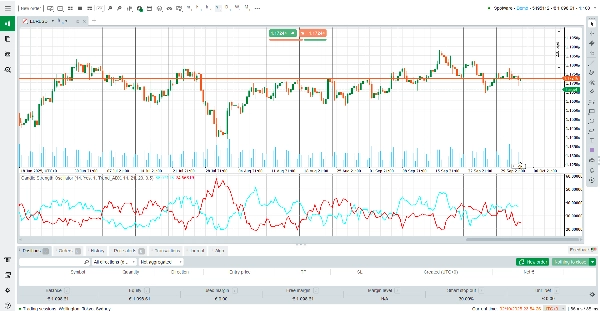
В отличие от традиционных осцилляторов, которые реагируют только на цену, CPI сочетает динамику тела свечи, моментум, взвешивание по объему и анализ тренда (ADX или EMA), чтобы дать вам всестороннее представление о рыночном давлении. С двумя плавными линиями – Давление Покупателей (голубая) и Давление Продавцов (красная) – трейдеры могут мгновенно увидеть, какая сторона рынка контролирует ситуацию.
Как читать индикатор
Давление Покупателей (голубая линия) – представляет интенсивность бычьего контроля. Растущая линия показывает увеличение доминирования покупателей.
Давление Продавцов (красная линия) – представляет интенсивность медвежьего контроля. Растущая линия показывает усиление силы продавцов.
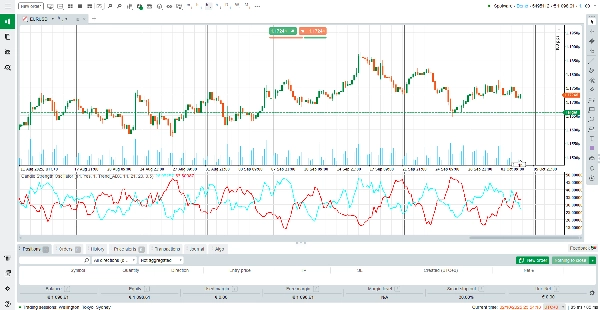
Пересечения – когда линия Покупателей пересекает линию Продавцов сверху, это сигнализирует о более сильном бычьем давлении (потенциальная возможность для покупки). Когда линия Продавцов пересекает сверху, доминирует медвежье давление (потенциальная возможность для продажи).
Зона уровня 50 – показания около середины (≈50) указывают на баланс между покупателями и продавцами, в то время как экстремальные значения (выше 75 или ниже 25) показывают сильное направленное давление.
Усиление фактора тренда – индикатор адаптирует свои сигналы на основе подтверждения тренда от ADX или наклона EMA, уменьшая ложные сигналы во время боковых движений рынка.
Как работает индикатор
CPI рассчитывает давление, используя взвешенную модель, которая учитывает:
Структуру свечи: размер тела и положение закрытия относительно максимума/минимума.
Моментум: движение цены по сравнению с предыдущей свечой.
Объем: взвешивание по тиковому объему гарантирует, что движения с высоким объемом имеют большее значение.
Подтверждение тренда: либо сила ADX, либо наклон EMA добавляют фактор усиления для согласования сигналов с преобладающим трендом.
Сглаживание: пользовательский фильтр SMA обеспечивает плавные и стабильные линии без потери отзывчивости.
Эта продвинутая формула означает, что CPI не только реагирует на цену, но и понимает, почему цена движется — давая трейдерам более глубокое понимание поведения рынка.
Ключевые особенности
Двойная визуализация линий – мгновенно сравнивайте давление покупателей и продавцов с помощью цветных линий (голубая для покупателей, красная для продавцов).
Адаптивное усиление тренда – интегрирует ADX или EMA для подтверждения направления тренда и снижения ложных сигналов.
Расчет с учетом объема – взвешенный по тиковому объему для выделения движений, поддержанных реальным участием рынка.
Сглаженный и чистый дисплей – встроенный фильтр SMA для плавных показаний без искажений с задержкой.
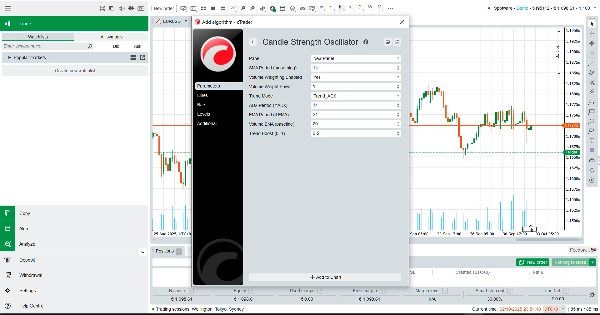
Полностью настраиваемый – регулируемые периоды, взвешивание и интенсивность усиления для соответствия любому стилю торговли.
Зачем использовать Индекс Давления Свечи?
CPI идеально подходит для трейдеров, которые хотят выйти за рамки простой ценовой динамики и увидеть настоящую борьбу между покупателями и продавцами. Независимо от того, являетесь ли вы скальпером, свинг-трейдером или следящим за трендом, этот бесплатный индикатор даст вам ясность, необходимую для точного тайминга входов, управления рисками и сохранения согласованности с реальным направлением рынка.
Скачайте Индекс Давления Свечи (CPI) сегодня — и торгуйте с уверенностью, понимая скрытые силы, движущие каждой свечой.
Сводка
The indicator displays two smooth lines: Buy Pressure (cyan) and Sell Pressure (red). Crossovers between these lines signal shifts in market dominance, helping traders identify trend strength, potential reversals, and optimal entry or exit points. Readings near the midpoint indicate balance, while extremes suggest strong directional pressure.
CPI incorporates volume-weighted calculations and trend-based boosts to reduce false signals during sideways markets. It includes a smoothing filter for stable, responsive readings and offers customization of periods, weighting, and trend boost intensity.
This tool is applicable across various markets including Forex, commodities, stocks, and cryptocurrencies, supporting trading strategies such as scalping and breakout trading. It aims to provide traders with enhanced insight into market dynamics beyond simple price action.
Отзывы покупателей
5 | 0 % | |
4 | 100 % | |
3 | 0 % | |
2 | 0 % | |
1 | 0 % |