Descrição
Estrutura de Mercado SC
Estrutura de Mercado SC é um indicador visual de estrutura de mercado projetado para identificar e exibir automaticamente os pontos mais importantes de máximas e mínimas oscilantes diretamente no gráfico.
O indicador analisa continuamente a ação do preço e mapeia a evolução da estrutura de mercado conectando máximas e mínimas significativas com linhas dinâmicas de estrutura. Isso permite que os traders reconheçam instantaneamente a direção da tendência, a continuação da tendência e potenciais pontos de reversão sem precisar marcar manualmente os movimentos do mercado.
Além disso, a Estrutura de Mercado SC classifica automaticamente cada novo ponto estrutural usando as definições padrão de estrutura de mercado:
- HH (Higher High)
- HL (Higher Low)
- LH (Lower High)
- LL (Lower Low)
Ao combinar a detecção automática de oscilações com a rotulagem da estrutura de mercado em tempo real, os traders podem entender rapidamente se o mercado está em tendência, consolidando ou mostrando sinais de uma possível reversão de tendência.
Principais Características
• Detecção automática de máximas e mínimas oscilantes significativas
• Linhas dinâmicas de estrutura conectando pivôs de mercado
• Identificação automática de Higher Highs (HH)
• Identificação automática de Higher Lows (HL)
• Identificação automática de Lower Highs (LH)
• Identificação automática de Lower Lows (LL)
• Visualização clara da estrutura de mercado altista e baixista
• Reconhecimento imediato de padrões de continuação e reversão de tendência
• Funciona em todos os mercados e prazos
• Apresentação limpa e intuitiva do gráfico
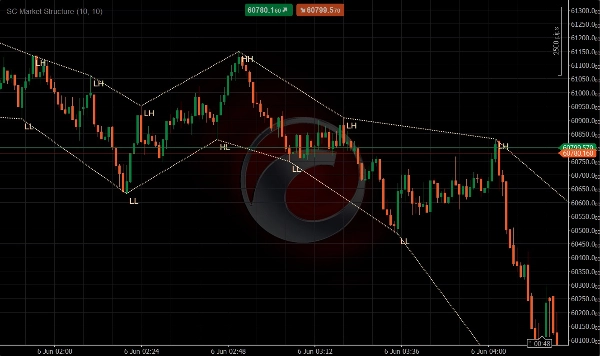
Visualização da Estrutura de Mercado
A Estrutura de Mercado SC avalia continuamente as oscilações de preço e rotula cada ponto estrutural recém-confirmado.
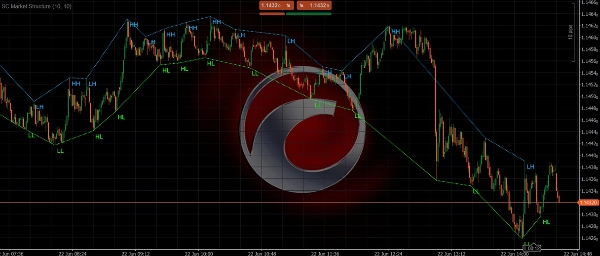
Estrutura Altista
Uma estrutura de mercado altista é identificada quando o preço forma:
• Higher Highs (HH)
• Higher Lows (HL)
Essa sequência indica que os compradores permanecem no controle e a tendência de alta ainda está intacta.
Estrutura Baixista
Uma estrutura de mercado baixista é identificada quando o preço forma:
• Lower Highs (LH)
• Lower Lows (LL)
Essa sequência indica que os vendedores permanecem no controle e a tendência de baixa ainda está intacta.
O indicador conecta visualmente esses pontos estruturais usando linhas de tendência dinâmicas, permitindo que os traders acompanhem a evolução da estrutura de preço em tempo real.
Por Que Usar a Estrutura de Mercado SC
Entender a estrutura de mercado é um dos aspectos mais importantes da negociação baseada na ação do preço.
Muitos traders desenham manualmente máximas, mínimas e estruturas de tendência, o que pode ser demorado e subjetivo.
A Estrutura de Mercado SC automatiza esse processo identificando objetivamente pivôs estruturais e rotulando-os de acordo com princípios profissionais de estrutura de mercado.
Isso permite que os traders:
• Leiam a direção da tendência mais rapidamente
• Identifiquem reversões potenciais mais cedo
• Confirmem configurações de continuação de tendência
• Melhorem o timing de entrada e saída
• Mantenham um gráfico mais limpo e organizado
Perfeito Para
• Traders de Price Action
• Scalpers
• Day traders
• Swing traders
• Traders que seguem tendências
• Traders de Estrutura de Mercado
• Traders do Conceito Smart Money (SMC)
• Traders que buscam análise objetiva da estrutura
Nota Importante
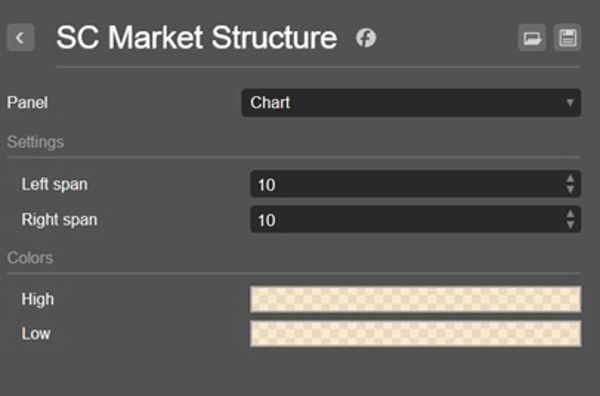
A Estrutura de Mercado SC identifica a estrutura de mercado com base em máximas e mínimas oscilantes confirmadas. Rótulos e linhas de estrutura são gerados somente após um pivô ter sido validado pelas configurações de cálculo selecionadas.
Ajustar as configurações de sensibilidade afetará a frequência com que novos pontos de estrutura são identificados e exibidos.
Ao contrário dos indicadores MACD tradicionais, seu conceito visual é construído em torno da integração da informação de momentum na análise da ação do preço. Por essa razão, não é recomendado usar o indicador em um painel separado, pois isso não proporciona a experiência de usuário pretendida.
Leia a tendência. Siga a estrutura. Negocie com confiança.
Resumo
By continuously analyzing price action, SC Market Structure helps traders quickly determine trend direction, recognize trend continuation, and spot potential reversal points without manual chart annotations. It supports all markets and timeframes, providing a clean and intuitive chart presentation.
This tool is suited for price action traders, scalpers, day traders, swing traders, trend followers, and those using Smart Money Concepts or seeking objective market structure analysis. Sensitivity settings allow customization of pivot detection frequency. The indicator integrates momentum information into price action analysis and is designed for direct chart overlay rather than separate panels.
Avaliações de clientes
5 | 100 % | |
4 | 0 % | |
3 | 0 % | |
2 | 0 % | |
1 | 0 % |


![Logótipo de "[Hamster-Coder] Moving Average MTF"](https://cdn.ctrader.com/image/webp/b11b98b1-194d-4b8e-b00e-d611826ad159_31226)