Descrição
DETECTOR DE SWING
Pontos Estruturais de Swing + Retração de Fibonacci + RSI
--------------------------------------------------
INDICADOR GRATUITO
Identifique swings estruturais. Veja a tendência. Negocie com confluência.
--------------------------------------------------
O QUE ESTE INDICADOR FAZ
O Detector de Swing identifica máximas e mínimas estruturais usando detecção de extremos locais com profundidade configurável e filtragem automática por desvio.
Em seguida, conecta os swings com linhas de tendência, sobrepõe níveis padrão de retração de Fibonacci e exibe o valor atual do RSI próximo ao preço.
--------------------------------------------------
PRINCIPAIS RECURSOS
- Detecção de pontos de swing (profundidade configurável)
- DESVIO AUTOMÁTICO: Filtragem baseada em ATR que se adapta a qualquer período
- Modo de desvio fixo em pips (para controle manual)
- Linhas de tendência de swing (alta azul, baixa laranja)
- RETRAÇÃO DE FIBONACCI (0, 23,6, 38,2, 50, 61,8, 78,6, 100 por cento)
- SOBREPOSIÇÃO DO VALOR RSI (RSI atual próximo ao preço)
- Cores personalizáveis
- Otimizado para desempenho (máximo de barras para desenhar)
--------------------------------------------------
DESVIO AUTOMÁTICO - RECURSO PRINCIPAL
Dois modos de desvio disponíveis:
- PIPS FIXOS: Defina uma distância mínima fixa em pips entre os swings
- BASEADO EM ATR (AUTO): Desvio dinâmico baseado na volatilidade atual
POR QUE O DESVIO AUTOMÁTICO É IMPORTANTE:
- M1 a M5: Desvio apertado (captura pequenos swings)
- H1 a H4: Desvio médio (captura estrutura)
- D1 a MN1: Desvio amplo (captura swings maiores)
O indicador se adapta automaticamente ao período que você está usando. Nenhum ajuste manual é necessário ao trocar de gráfico.
Isso torna o Detector de Swing utilizável em TODOS os períodos — de gráficos de 1 minuto a mensais.
--------------------------------------------------
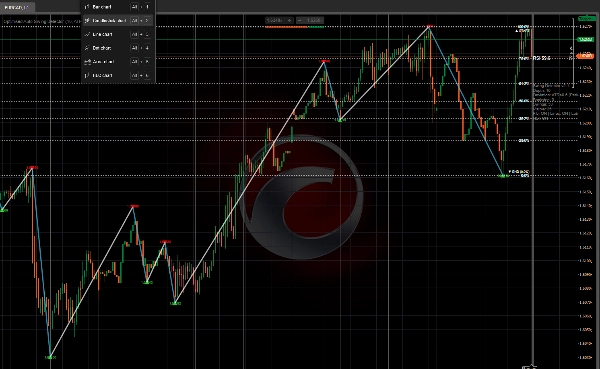
RETRAÇÃO DE FIBONACCI - RECURSO PRINCIPAL
Para o último swing concluído, o indicador desenha:
- 0,0 por cento (início do swing)
- 23,6 por cento
- 38,2 por cento
- 50,0 por cento
- 61,8 por cento
- 78,6 por cento
- 100,0 por cento (fim do swing)
Ative ou desative linhas e etiquetas. Todos os níveis são codificados por cores para referência visual rápida.
--------------------------------------------------
SOBREPOSIÇÃO RSI - RECURSO PRINCIPAL
O valor atual do RSI é exibido próximo ao preço com codificação por cores:
- VERMELHO: RSI acima de 70 (sobrecomprado)
- VERDE: RSI abaixo de 30 (sobrevendido)
- BRANCO: RSI entre 30 e 70 (neutro)
Isso fornece contexto imediato de momentum sem abrir uma janela separada do RSI.
--------------------------------------------------
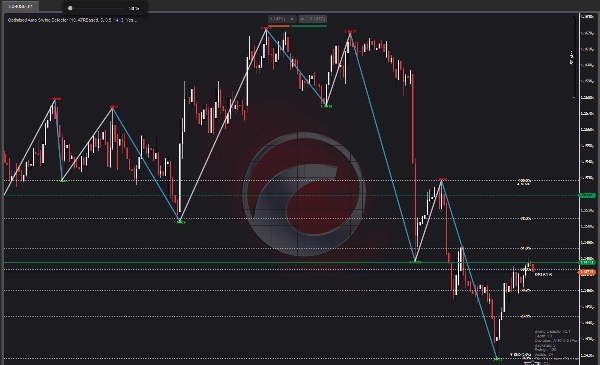
ELEMENTOS VISUAIS
- Setas vermelhas para baixo = Máximas de swing
- Setas verdes para cima = Mínimas de swing
- Linhas azuis = Alta (de mínimo a máximo)
- Linhas laranja = Baixa (de máximo a mínimo)
- Linhas horizontais douradas = Níveis de Fibonacci
- Etiquetas brancas = Percentuais de Fibonacci
- Valor RSI = RSI atual próximo ao preço
- Painel de informações = Profundidade, desvio, retrocesso, contagem de swings
--------------------------------------------------
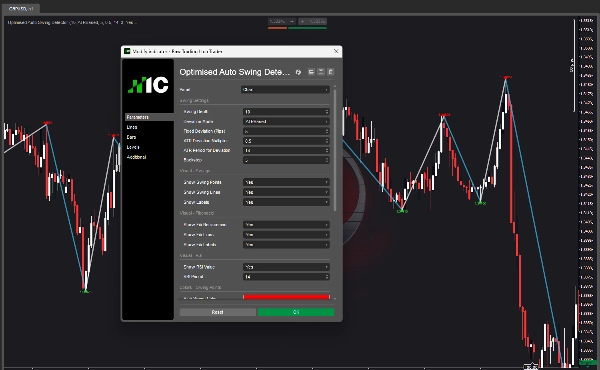
VISÃO GERAL DOS PARÂMETROS
CONFIGURAÇÕES DE SWING:
- Profundidade do Swing: Quantas barras verificar para extremos locais
- Modo de Desvio: Pips Fixos ou Baseado em ATR (Automático)
- Desvio Fixo: Distância mínima em pips entre swings
- Multiplicador de Desvio ATR: Multiplicador para desvio baseado em ATR
- Período ATR: Período para cálculo do ATR
- Retrocesso: Mínimo de barras entre swings
VISUAL - SWINGS:
- Mostrar Pontos de Swing: Alternar setas
- Mostrar Linhas de Swing: Alternar linhas de tendência
- Mostrar Etiquetas: Alternar etiquetas de preço
VISUAL - FIBONACCI:
- Mostrar Retração Fib: Alternar sobreposição de Fibonacci
- Mostrar Linhas Fib: Alternar linhas horizontais
- Mostrar Etiquetas Fib: Alternar etiquetas percentuais
VISUAL - RSI:
- Mostrar Valor RSI: Alternar sobreposição RSI
- Período RSI: Período para cálculo do RSI
CORES:
- Cor do Swing Alto
- Cor do Swing Baixo
- Cor da Linha de Alta
- Cor da Linha de Baixa
- Cor da Linha Fib
- Cor do Texto Fib
- Cor da Etiqueta RSI
DESEMPENHO:
- Máximo de Barras para Desenhar: Limita o desenho para melhor desempenho
--------------------------------------------------
CASOS DE USO
- Identificar pontos estruturais de swing em QUALQUER período
- Desenhar linhas de tendência entre swings
- Usar níveis de Fibonacci para entradas, saídas e metas de lucro
- Confirmar negociações com confluência do RSI
- Entender a estrutura do mercado rapidamente
- Trocar de períodos sem ajustar parâmetros (Desvio Automático)
--------------------------------------------------
USABILIDADE DE PERÍODOS
Com o DESVIO AUTOMÁTICO ativado, o indicador funciona em:
- M1, M5, M15 (scalping)
- M30, H1, H4 (day trading)
- D1 (swing trading)
- W1, MN1 (position trading)
Um indicador. Todos os períodos.
--------------------------------------------------
ATUALIZE PARA ZONAS DE CALOR ESTRUTURAIS
Este indicador gratuito mostra swings e estrutura.
Zonas de Calor Estruturais vão além — mapeiam intensidade de participação, aceitação vs rejeição e engajamento do mercado em múltiplas zonas.
Procure por Zonas de Calor Estruturais na Loja cTrader.
--------------------------------------------------
ATUALIZE PARA INVICTUS EA
Invictus EA usa a mesma tecnologia estrutural para executar negociações automatizadas.
Procure por Invictus na Loja cTrader.
--------------------------------------------------
NOTAS TÉCNICAS
- Indicador sobreposto
- Funciona em qualquer período e símbolo
- Sem repintura (swings são históricos)
- Otimizado para desempenho
--------------------------------------------------
SUPORTE
Atualizações vitalícias incluídas.
PARA MAIS INFORMAÇÕES - Clique no Perfil do Desenvolvedor abaixo.
Resumo
Avaliações de clientes
5 | 100 % | |
4 | 0 % | |
3 | 0 % | |
2 | 0 % | |
1 | 0 % |